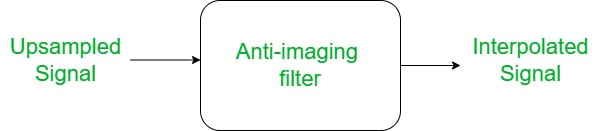
El sobremuestreo con filtrado da la señal interpolada. El proceso Upsampling simplemente agrega muestras de valor cero a la señal de entrada dada. No hay importancia práctica de muestras de valor cero para obtener señales interpoladas. De hecho, estas muestras de valor cero deben convertirse en sus valores aproximados en función de las muestras anteriores y futuras presentes en la señal de entrada. El trabajo de conversión de muestras de valor cero a muestras de magnitud aproximada se realiza mediante filtrado.
Por lo tanto, el filtrado es un paso importante para obtener una señal interpolada después del muestreo ascendente.
Ejemplo:
Matlab
% MATLAB code to perform filtering
% and obtaining Interpolated signal:
% filtfilt command provides zero-phase digital
% filtering by processing input data x
% in both forward and reverse directions
Syntax: y=filtfilt(b,a,x);
% b,a specifies the filter order
% x is input data
% taking sampling frequency as input and
% storing in fs variable
fs=input('enter sampling frequency');
% taking frequency of the signal as
% input and storing in f
f=input('enter frequency of signal');
% taking interpolation factor I as input
% and storing it in L
L=input('enter interpolation factor');
%defining time-axis
t=0:1/fs:1;
% generating a sinusoidal signal with
% a given frequency and time-axis tf
x=sin(2*pi*f*t);
% storing length of axis x in N
N=length(x);
% taking another axis ranging from 0 to N-1
n=0:N-1;
% taking another axis ranging from 0 to N*L-1
m=0:(N*L)-1;
% creating zeros in axis of length L*N and storing it in x1
x1=zeros(1,L*N);
% taking another axis with a interpolation
% factor L form 0 to increasing with a factor L and upto N*L
j=1:L:N*L;
% taking j values into x1 from x
x1(j)=x;
% creating a window-based finite inpulse response filter design
% Syntax: b = fir1(n,Wn,'ftype')
% n is number of samples ranging from 0 to N-1,
% Wn is normalized frequency ranging from 0 to 1,
% 'ftype' specifies a filter type
f1=fir1(34,0.48,'low');
% filtfilt command provides zero-phase digital filtering
% by processing input data x in both forward and reverse directions
% Syntax: y=filtfilt(b,a,x);
% b,a specifies the filter order
% x is input data
output=2*filtfilt(f1,1,x1);
% Syntax: y=interp(x,r);
% the above command specifies increasing the sampling
% rate of signal x by a factor of r.
y=interp(x,L);
% subplot command in MATLAB allows you to insert
% multiple plots in a grid where all plots are specified in same grid
subplot(2,1,1);
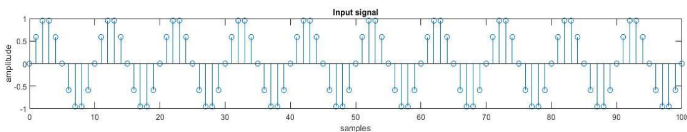
% stem command is to plot discrete signal
stem(n,x);
% xlabel shows name of x axis in a plot
xlabel('samples');
% ylabel shows name of y axis in a plot
ylabel('amplitude');
% title is shown at the top of figure
% title is usually used to specify the name of your figure
title('Input signal');
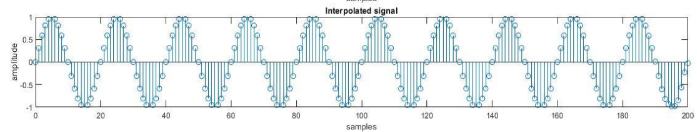
subplot(2,1,2);
stem(m,output);
% axis command specifies the limit of current axis
axis ([0 200 -1 1]);
xlabel('samples');
ylabel('amplitude');
%Interpolated signal or Filtered signal
title('Interpolated signal');
Producción:
Publicación traducida automáticamente
Artículo escrito por abdulmalikpasha y traducido por Barcelona Geeks. The original can be accessed here. Licence: CCBY-SA