En este artículo, haremos el gráfico 3D resolviendo las ecuaciones lineales usando Python.
Resolver ecuaciones lineales en Python
Aquí vamos a crear una variable diferente para asignar el valor a una ecuación lineal y luego calcularemos el valor usando los métodos linalg.solve().
Python3
# Python program to solve linear
# equation and return 3-d graph

# IMport the libraries
import numpy as np

x1, y1, z1, w1 = 1, -2, 3, 9

# Take the input for equation-2
x2, y2, z2, w2 = -1, 3, -1, -6

# Take the input for equation-3
x3, y3, z3, w3 = 2, -5, 5, 17

# Create an array for LHS variables
LHS = np.array([[x1, y1, z1],
                [x2, y2, z2],
                [x3, y3, z3]])

# Create another array for RHS variables
RHS = np.array([w1, w2, w3])

# Apply linear algebra on any numpy
# array created and printing the output
sol = np.linalg.solve(LHS, RHS)
print(sol)
Producción:
[ 1. -1. 2.]
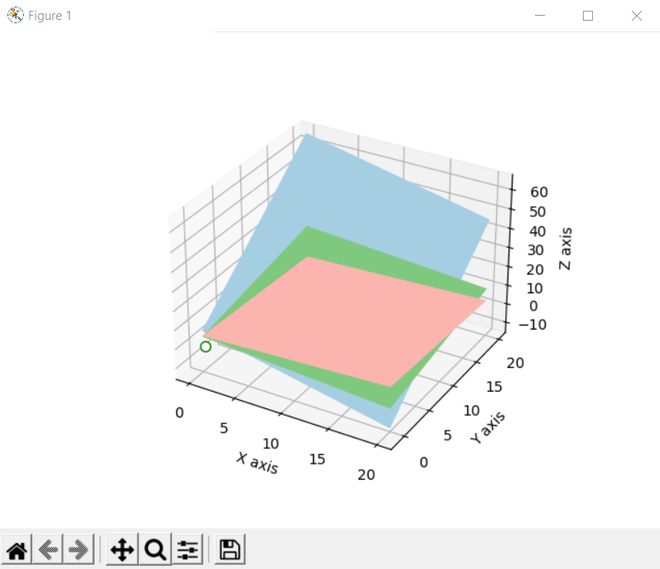
Resuelva la ecuación lineal y devuelva el gráfico 3D
Después de obtener la ecuación lineal, trazaremos el gráfico 3d usando matplotlib. creamos los gráficos 3D usando la función figure(). Además, usamos el módulo de figura del método add_subplot() de la biblioteca matplotlib para agregar ejes a la figura como parte de un arreglo de subtrama.
Python3
import matplotlib.pyplot as plt
from matplotlib import cm

# Returns number spaces evenly w.r.t
# interval
x_axis, y_axis = np.linspace(0, 20, 10),
np.linspace(0, 20, 10)

# Create a rectangular grid out of
# two given one-dimensional arrays
X, Y = np.meshgrid(x_axis, y_axis)

# Make a rectangular grid
# 3-dimensional by calculating z1, z2, z3
Z1 = (w1-x1*X-y1*Y)/z1
Z2 = (w2-x2*X-y2*Y)/z2
Z3 = (w3+X-Y)/z3

# Create 3D graphics and add
# an add an axes to the figure
fig = plt.figure()
ax = fig.add_subplot(111, projection='3d')

# Create a 3D Surface Plot
ax.plot_surface(X, Y, Z1, alpha=1,
                cmap=cm.Accent,
                rstride=100, cstride=100)
ax.plot_surface(X, Y, Z2, alpha=1,
                cmap=cm.Paired,
                rstride=100, cstride=100)
ax.plot_surface(X, Y, Z3, alpha=1,
                cmap=cm.Pastel1,
                rstride=100, cstride=100)

# Draw points and make lines
ax.plot((sol[0],), (sol[1],), (sol[2],),
        lw=2, c='k', marker='o',
        markersize=7, markeredgecolor='g',
        markerfacecolor='white')

# Set the label for x-axis, y-axis and
# z-axis
ax.set_xlabel('X axis')
ax.set_ylabel('Y axis')
ax.set_zlabel('Z axis')

# Display all figures
plt.show()
Producción:
