En este artículo, discutiremos cómo crear un gráfico de barras apiladas en Seaborn en Python.
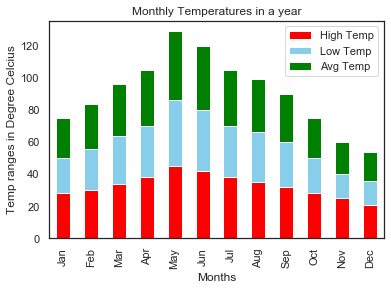
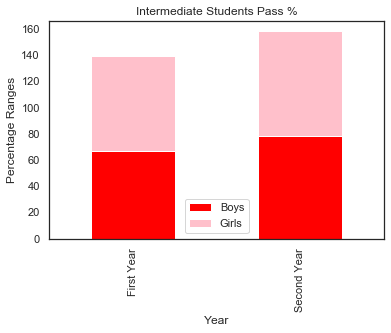
Un gráfico de barras apiladas es un tipo de gráfico de barras en el que cada barra se divide visualmente en subbarras para representar datos de varias columnas a la vez. Para trazar el gráfico de barras apiladas, necesitamos especificar stacked=True en el método de trazado. También podemos pasar la lista de colores según sea necesario para colorear cada barra secundaria en una barra.
Sintaxis:
DataFrameName.plot(tipo=’barra’, apilado=Verdadero, color=[…..])
Ejemplo: gráfico de barras apiladas
Conjunto de datos en uso:
|
|
Alta temperatura |
Baja temperatura |
Temp. media |
|---|---|---|---|
|
Ene |
28 |
22 |
25 |
|
Feb |
30 |
26 |
28 |
|
Mar |
34 |
30 |
32 |
|
Abr |
38 |
32 |
35 |
|
Mayo |
45 |
41 |
43 |
|
Jun |
42 |
38 |
40 |
|
Jul |
38 |
32 |
35 |
|
Ago |
35 |
31 |
33 |
|
Sep |
32 |
28 |
30 |
|
Oct |
28 |
22 |
25 |
|
Nov |
25 |
15 |
20 |
|
Dic |
21 |
15 |
18 |
Python3
# import necessary libraries
import pandas as pd
import seaborn as sns
import matplotlib.pyplot as plt

# create DataFrame
df = pd.DataFrame({'High Temp': [28, 30, 34, 38, 45, 42,
                                 38, 35, 32, 28, 25, 21],
                   'Low Temp': [22, 26, 30, 32, 41, 38,
                                32, 31, 28, 22, 15, 15],
                   'Avg Temp': [25, 28, 32, 35, 43, 40,
                                35, 33, 30, 25, 20, 18]},
                  index=['Jan', 'Feb', 'Mar', 'Apr', 'May',
                         'Jun', 'Jul', 'Aug', 'Sep', 'Oct',
                         'Nov', 'Dec'])


# create stacked bar chart for monthly temperatures
df.plot(kind='bar', stacked=True, color=['red', 'skyblue', 'green'])

# labels for x & y axis
plt.xlabel('Months')
plt.ylabel('Temp ranges in Degree Celsius')

# title of plot
plt.title('Monthly Temperatures in a year')
Producción:

Ejemplo: gráfico de barras apiladas
Conjunto de datos en uso:
|
|
Niños |
Muchachas |
|---|---|---|
|
Primer año |
67 |
72 |
|
Segundo año |
78 |
80 |
Python3
# import necessary libraries
import pandas as pd
import seaborn as sns
import matplotlib.pyplot as plt

# create DataFrame
students = pd.DataFrame({'Boys': [67, 78],
                         'Girls': [72, 80], },
                        index=['First Year', 'Second Year'])


# create stacked bar chart for students DataFrame
students.plot(kind='bar', stacked=True, color=['red', 'pink'])

# Add Title and Labels
plt.title('Intermediate Students Pass %')
plt.xlabel('Year')
plt.ylabel('Percentage Ranges')
Producción

Publicación traducida automáticamente
Artículo escrito por akhilvasabhaktula03 y traducido por Barcelona Geeks. The original can be accessed here. Licence: CCBY-SA