Matplotlib es una increíble biblioteca de visualización en Python para gráficos 2D de arrays. Matplotlib es una biblioteca de visualización de datos multiplataforma basada en arrays NumPy y diseñada para funcionar con la pila SciPy más amplia.
matplotlib.ticker.AutoMinorLocator
La matplotlib.ticker.AutoMinorLocatorclase se utiliza para encontrar posiciones de ticks menores en función de las posiciones de los ticks principales de forma dinámica. Las marcas principales deben estar espaciadas uniformemente junto con una escala lineal.
Sintaxis: clase matplotlib.ticker.AutoMinorLocator(n=Ninguno)
parámetro:
- n: representa el número de subdivisiones del intervalo entre ticks principales. Si se omite n o Ninguno, se establece automáticamente en 5 o 4.
Métodos de la clase:
- tick_values(self, vmin, vmax): dados vmin y vmax, devuelve el valor de los ticks localizados.
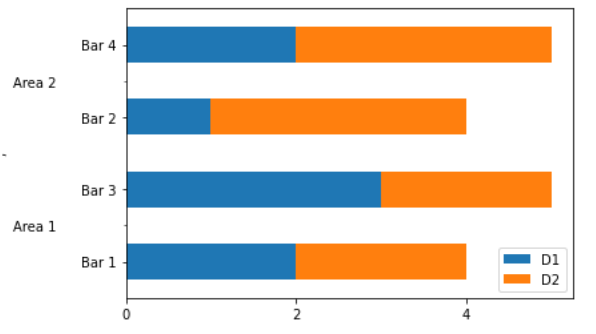
Ejemplo 1:
import pandas as pd
import matplotlib.pyplot as plt
from matplotlib import ticker

data = [
    ('Area 1', 'Bar 1', 2, 2),
    ('Area 2', 'Bar 2', 1, 3),
    ('Area 1', 'Bar 3', 3, 2),
    ('Area 2', 'Bar 4', 2, 3),
]

df = pd.DataFrame(data, columns =('A', 'B',
                                  'D1', 'D2'))

df = df.set_index(['A', 'B'])
df.sort_index(inplace = True)

# Remove the index names for the plot,
# or it'll be used as the axis label
df.index.names = ['', '']

ax = df.plot(kind ='barh', stacked = True)

minor_locator = ticker.AutoMinorLocator(2)

ax.yaxis.set_minor_locator(minor_locator)

ax.set_yticklabels(df.index.get_level_values(1))
ax.set_yticklabels(df.index.get_level_values(0).unique(),
                   minor = True)

ax.set_yticks(np.arange(0.5, len(df), 2),
              minor = True)

ax.tick_params(axis ='y', which ='minor',
               direction ='out', pad = 50)

plt.show()
Producción:
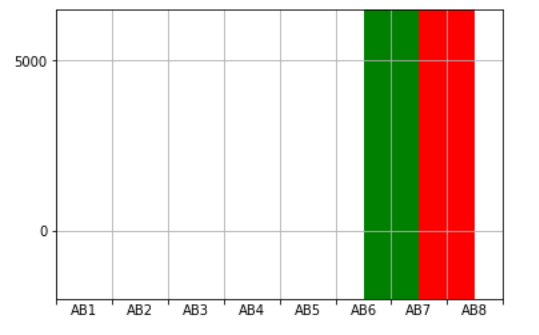
Ejemplo 2:
from pylab import *
import matplotlib
import matplotlib.ticker as ticker


# Setting minor ticker size to 0,
# globally.
matplotlib.rcParams['xtick.minor.size'] = 0

# Create a figure with just one
# subplot.
fig = figure()
ax = fig.add_subplot(111)

# Set both X and Y limits so that
# matplotlib
ax.set_xlim(0, 800)

# Fixes the major ticks to the places
# where desired (one every hundred units)
ax.xaxis.set_major_locator(ticker.FixedLocator(range(0,
                                                     801,
                                                     100)))
ax.xaxis.set_major_formatter(ticker.NullFormatter())

# Add minor tickers AND labels for them
ax.xaxis.set_minor_locator(ticker.AutoMinorLocator(n = 2))
ax.xaxis.set_minor_formatter(ticker.FixedFormatter(['AB %d' % x
                                                    for x in range(1, 9)]))

ax.set_ylim(-2000, 6500, auto = False)

# common attributes for the bar plots
bcommon = dict(
    height = [8500],
    bottom = -2000,
    width = 100)


bars = [[600, 'green'],
        [700, 'red']]
for left, clr in bars:
    bar([left], color = clr, **bcommon)


show()
Producción:
Publicación traducida automáticamente
Artículo escrito por RajuKumar19 y traducido por Barcelona Geeks. The original can be accessed here. Licence: CCBY-SA