En este artículo veremos cómo podemos crear un elemento gráfico en PyQTGraph. PyQtGraph es una biblioteca de interfaz de usuario y gráficos para Python que proporciona la funcionalidad comúnmente requerida en el diseño y las aplicaciones científicas. Sus objetivos principales son proporcionar gráficos rápidos e interactivos para mostrar datos (gráficos, videos, etc.). Un gráfico es una estructura de datos no lineal que consta de Nodes y bordes. Los Nodes a veces también se conocen como vértices y los bordes son líneas o arcos que conectan dos Nodes en el gráfico. El gráfico consta de un conjunto finito de vértices (o Nodes) y un conjunto de bordes que conectan un par de Nodes.
Podemos crear un widget de diseño gráfico con la ayuda del comando que se indica a continuación
# creating graphics layout widget
win = pg.GraphicsLayoutWidget()
Para poder graficar el video tenemos que hacer lo siguiente
- Importe el módulo pyqtgraph, pyqt5 y numpy.
- Cree una clase de ventana principal.
- Cree un widget de diseño gráfico y agréguele un cuadro de vista de imagen.
- Cree un elemento de gráfico y agréguelo al cuadro de vista.
- Establezca las posiciones de los Nodes y los bordes, es decir, las conexiones y establezca símbolos para ellos.
- Cree un diseño de cuadrícula y agréguele la ventana de diseño gráfico con otros widgets y establezca el widget de cuadrícula como widget central de la ventana principal.
A continuación se muestra la implementación.
Python3
# importing Qt widgets
from PyQt5.QtWidgets import *
# importing system
import sys
# importing numpy as np
import numpy as np
# importing pyqtgraph as pg
import pyqtgraph as pg
from PyQt5.QtGui import *
from PyQt5.QtCore import *
import pyqtgraph.ptime as ptime
# Image View class
class ImageView(pg.ImageView):
# constructor which inherit original
# ImageView
def __init__(self, *args, **kwargs):
pg.ImageView.__init__(self, *args, **kwargs)
class Window(QMainWindow):
def __init__(self):
super().__init__()
# setting title
self.setWindowTitle("PyQtGraph")
# setting geometry
self.setGeometry(100, 100, 600, 500)
# icon
icon = QIcon("skin.png")
# setting icon to the window
self.setWindowIcon(icon)
# calling method
self.UiComponents()
# showing all the widgets
self.show()
# method for components
def UiComponents(self):
# creating a widget object
widget = QWidget()
# creating a label
label = QLabel("Geeksforgeeks Graph Item")
# setting minimum width
label.setMinimumWidth(130)
# making label do word wrap
label.setWordWrap(True)
# setting configuration options
pg.setConfigOptions(antialias=True)
# creating graphics layout widget
win = pg.GraphicsLayoutWidget()
# adding view box to the graphic layout widget
view = win.addViewBox()
# lock the aspect ratio
view.setAspectLocked()
# creating a graph item
graph_item = pg.GraphItem()
# adding graph item to the view box
view.addItem(graph_item)
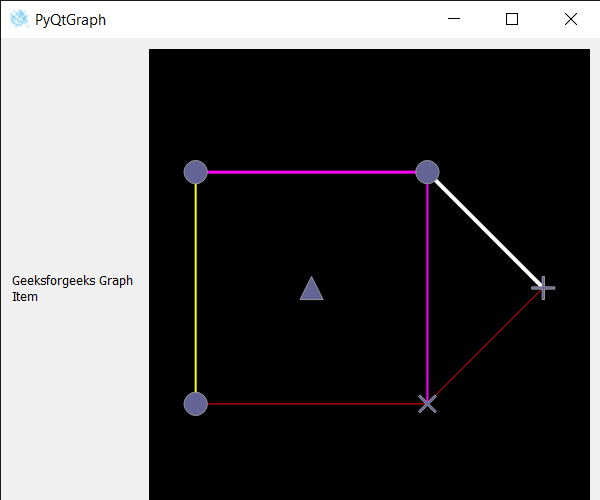
# Define positions of nodes
pos = np.array([
[0, 0],
[10, 0],
[0, 10],
[10, 10],
[5, 5],
[15, 5]
])
# Define the set of connections in the graph
adj = np.array([
[0, 1],
[1, 3],
[3, 2],
[2, 0],
[1, 5],
[3, 5],
])
# Define the symbol to use for each node (this is optional)
symbols = ['o', 'x', 'o', 'o', 't', '+']
# Define the line style for each connection (this is optional)
lines = np.array([
(255, 0, 0, 255, 1),
(255, 0, 255, 255, 2),
(255, 0, 255, 255, 3),
(255, 255, 0, 255, 2),
(255, 0, 0, 255, 1),
(255, 255, 255, 255, 4),
], dtype=[('red', np.ubyte), ('green', np.ubyte), ('blue', np.ubyte), ('alpha', np.ubyte), ('width', float)])
# Update the graph
graph_item.setData(pos=pos, adj=adj, pen=lines,
size=1, symbol=symbols, pxMode=False)
# Creating a grid layout
layout = QGridLayout()
# minimum width value of the label
label.setMinimumWidth(130)
# setting this layout to the widget
widget.setLayout(layout)
# adding label in the layout
layout.addWidget(label, 1, 0)
# plot window goes on right side, spanning 3 rows
layout.addWidget(win, 0, 1, 3, 1)
# setting this widget as central widget of the main window
self.setCentralWidget(widget)
# create pyqt5 app
App = QApplication(sys.argv)
# create the instance of our Window
window = Window()
# start the app
sys.exit(App.exec())
Producción :
Publicación traducida automáticamente
Artículo escrito por rakshitarora y traducido por Barcelona Geeks. The original can be accessed here. Licence: CCBY-SA