Matplotlib es una increíble biblioteca de visualización en Python para gráficos 2D de arrays. Matplotlib es una biblioteca de visualización de datos multiplataforma basada en arrays NumPy y diseñada para funcionar con la pila SciPy más amplia.
Trabajar con imágenes en Python usando Matplotlib
El imagemódulo de matplotlibla biblioteca se utiliza para trabajar con imágenes en Python. El imagemódulo también incluye dos métodos útiles: cuál imreadse usa para leer imágenes y imshowcuál se usa para mostrar la imagen.
A continuación se muestran algunos ejemplos que ilustran varias operaciones en imágenes usando matplotlibla biblioteca:
Ejemplo 1: En este ejemplo, el programa lee una imagen usando matplotlib.image.imread()y muestra esa imagen usando matplotlib.image.imread().
# importing required libraries
import matplotlib.pyplot as plt
import matplotlib.image as img

# reading the image
testImage = img.imread('g4g.png')

# displaying the image
plt.imshow(testImage)
Producción: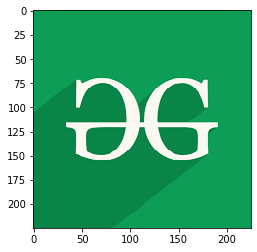
Ejemplo 2: El siguiente programa lee una imagen y luego representa la imagen en una array.
# importing required libraries
import matplotlib.pyplot as plt
import matplotlib.image as img

# reading the image
testImage = img.imread('g4g.png')

# displaying the image as an array
print(testImage)
Producción:
[[[0.05490196 0.6156863  0.34117648]
  [0.05490196 0.6156863  0.34117648]
  [0.05490196 0.6156863  0.34117648]
  ...
  [0.05490196 0.6156863  0.34117648]
  [0.05490196 0.6156863  0.34117648]
  [0.05490196 0.6156863  0.34117648]]

 [[0.05490196 0.6156863  0.34117648]
  [0.05490196 0.6156863  0.34117648]
  [0.05490196 0.6156863  0.34117648]
  ...
  [0.05490196 0.6156863  0.34117648]
  [0.05490196 0.6156863  0.34117648]
  [0.05490196 0.6156863  0.34117648]]

 [[0.05490196 0.6156863  0.34117648]
  [0.05490196 0.6156863  0.34117648]
  [0.05490196 0.6156863  0.34117648]
  ...
  [0.05490196 0.6156863  0.34117648]
  [0.05490196 0.6156863  0.34117648]
  [0.05490196 0.6156863  0.34117648]]

 ...

 [[0.03529412 0.52156866 0.28235295]
  [0.03529412 0.52156866 0.28235295]
  [0.03529412 0.52156866 0.28235295]
  ...
  [0.05490196 0.6156863  0.34117648]
  [0.05490196 0.6156863  0.34117648]
  [0.05490196 0.6156863  0.34117648]]

 [[0.03529412 0.52156866 0.28235295]
  [0.03529412 0.52156866 0.28235295]
  [0.03529412 0.52156866 0.28235295]
  ...
  [0.05490196 0.6156863  0.34117648]
  [0.05490196 0.6156863  0.34117648]
  [0.05490196 0.6156863  0.34117648]]

 [[0.03529412 0.52156866 0.28235295]
  [0.03529412 0.52156866 0.28235295]
  [0.03529412 0.52156866 0.28235295]
  ...
  [0.05490196 0.6156863  0.34117648]
  [0.05490196 0.6156863  0.34117648]
  [0.05490196 0.6156863  0.34117648]]]
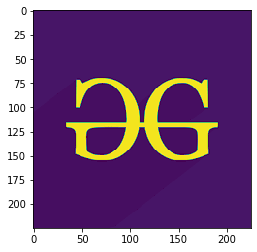
Ejemplo 3: Aquí, la forma de la imagen es (225, 225, 3)la que representa (alto, ancho, modo) de la imagen, para el valor del modo de imagen en color es de 0 a 2 y para el valor del modo de imagen en blanco y negro es 0 y 1 solamente. En la imagen de salida, solo se modifica el modo de la imagen.
# importing required libraries
import matplotlib.pyplot as plt
import matplotlib.image as img

# reading the image
testImage = img.imread('g4g.png')

# displaying the shape of the image
print(testImage.shape)

# modifying the shape of the image
modifiedImage = testImage[:, :, 0]

# displaying the modified image
plt.imshow(modifiedImage)
Producción:
(225, 225, 3)
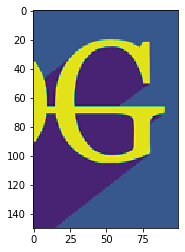
Ejemplo 4: En el siguiente programa, se modifican todos los parámetros de la forma de la imagen. Aquí, la altura de la imagen es de 150 píxeles (que se muestra desde el píxel 50), el ancho es de 100 píxeles (que se muestra desde el píxel 100) y el valor del modo es 1.
# importing required libraries
import matplotlib.pyplot as plt
import matplotlib.image as img

# reading the image
testImage = img.imread('g4g.png')

# displaying the shape of the image
print(testImage.shape)

# modifying the shape of the image
modifiedImage = testImage[50:200, 100:200, 1]

# displaying the modified image
plt.imshow(modifiedImage)
Producción:
(225, 225, 3)
Ejemplo 5: Aquí no se modifica ninguno de los parámetros. Entonces, se muestra la imagen original.
# importing required libraries
import matplotlib.pyplot as plt
import matplotlib.image as img

# reading the image
testImage = img.imread('g4g.png')

# displaying the shape of the image
print(testImage.shape)

# modifying the shape of the image
modifiedImage = testImage[:, :, :]

# displaying the modified image
plt.imshow(modifiedImage)
Producción:
(225, 225, 3)
Publicación traducida automáticamente
Artículo escrito por riturajsaha y traducido por Barcelona Geeks. The original can be accessed here. Licence: CCBY-SA