Pyplot es otro módulo de matplotlib que permite a los usuarios integrar MATLAB en el entorno de Python y, por lo tanto, proporciona una interfaz similar a MATLAB y hace que Python sea visualmente interactivo.
Matplotlib.pyplot.axes()
pyplot.axeses una función de la biblioteca matplotlib que agrega ejes al gráfico actual y lo convierte en ejes actuales. Su salida depende de los argumentos utilizados.
Sintaxis: matplotlib.pyplot.axes(*args, **kwargs)
Parámetros:
*args: Puede incluir Ninguno(nada) o 4 tuplas de tipo float
- ninguno: da una nueva ventana completa de ejes
- 4 tuplas: toma 4 tuplas como lista, es decir, [ancho inferior izquierdo alto] y da una ventana de estas dimensiones como ejes.
**kwargs: hay varios argumentos de palabras clave (kwargs) que se usan como parámetros para pyplot.axes(), los más comunes incluyen facecolor, gid, in_layout, label, position, xlim, ylim, etc.
Ejemplo 1:
# importing matplot library along
# with necessary modules
import matplotlib.pyplot as plt


# providing values to x and y
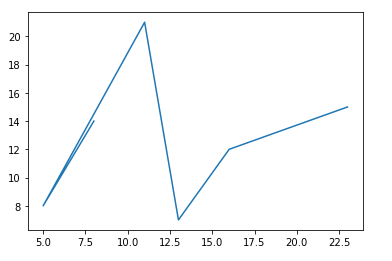
x = [8, 5, 11, 13, 16, 23]
y = [14, 8, 21, 7, 12, 15]

# to plot x and y
plt.plot(x, y)

# to generate the full window axes
plt.axes()
Producción:
Ejemplo 2:
# importing matplot library along
# with necessary modules
import matplotlib.pyplot as plt


# providing values to x and y
x = [8, 5, 11, 13, 16, 23]
y = [14, 8, 21, 7, 12, 15]

# to plot x and y
#plt.plot(x, y)
# to generate window of custom
# dimensions [left, bottom, width,
# height] along with the facecolor
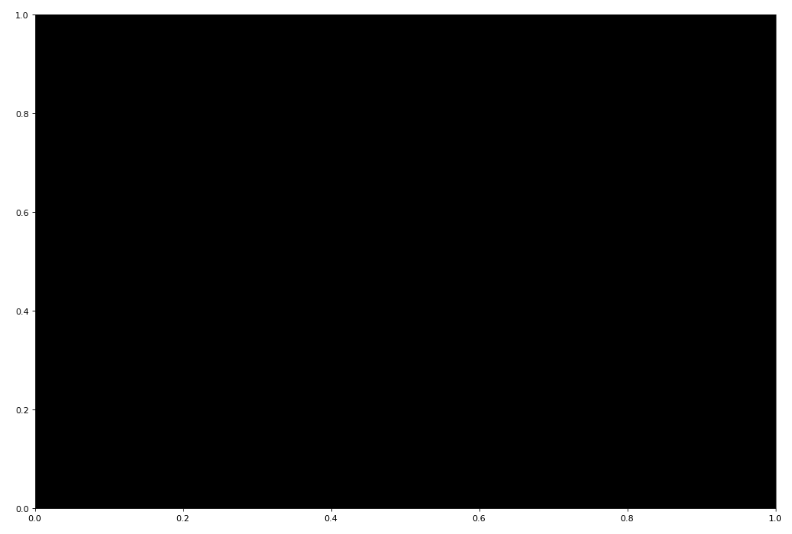
plt.axes([0, 2.0, 2.0, 2.0], facecolor = 'black')
Producción:

Publicación traducida automáticamente
Artículo escrito por afshan_mairaj y traducido por Barcelona Geeks. The original can be accessed here. Licence: CCBY-SA