En este artículo, veremos cómo podemos obtener el valor mínimo-máximo de los datos del objeto de vista de imagen en PyQTGaph. PyQtGraph es una biblioteca de interfaz de usuario y gráficos para Python que proporciona la funcionalidad comúnmente requerida en el diseño y las aplicaciones científicas. Sus objetivos principales son proporcionar gráficos rápidos e interactivos para mostrar datos (gráficos, videos, etc.). Widget utilizado para mostrar y analizar datos de imágenes. Implementa muchas funciones, como mostrar datos de imágenes en 2D y 3D. Para datos 3D, se muestra un control deslizante del eje z que permite al usuario seleccionar qué cuadro se muestra. Muestra el histograma de los datos de la imagen con una región móvil que define los niveles oscuros/claros, el degradado editable proporciona una tabla de búsqueda de colores, el control deslizante del marco también se puede mover usando las teclas de flecha izquierda/derecha, así como pgpgn, pgn, home y end. Quick min-max estima los valores mínimos/máximos de *datos* mediante submuestreo. Devuelve [(min, max), …] con un elemento por canal
Podemos crear una vista de imagen con la ayuda del comando que se indica a continuación.
# creating a pyqtgraph image view object
imv = pg.ImageView()
Para hacer esto, usamos el método quickMinMax con el objeto de vista de imagen
Sintaxis: imv.quickMinMax (img)
Argumento: toma numpy ndarray como argumento
Retorno: devuelve la lista
A continuación se muestra la implementación.
Python3
# importing Qt widgets
from PyQt5.QtWidgets import *
# importing system
import sys
# importing numpy as np
import numpy as np
# importing pyqtgraph as pg
import pyqtgraph as pg
from PyQt5.QtGui import *
from PyQt5.QtCore import *
# Image View class
class ImageView(pg.ImageView):
# constructor which inherit original
# ImageView
def __init__(self, *args, **kwargs):
pg.ImageView.__init__(self, *args, **kwargs)
class Window(QMainWindow):
def __init__(self):
super().__init__()
# setting title
self.setWindowTitle("PyQtGraph")
# setting geometry
self.setGeometry(100, 100, 600, 500)
# icon
icon = QIcon("skin.png")
# setting icon to the window
self.setWindowIcon(icon)
# calling method
self.UiComponents()
# showing all the widgets
self.show()
# setting fixed size of window
self.setFixedSize(QSize(600, 500))
# method for components
def UiComponents(self):
# creating a widget object
widget = QWidget()
# creating a label
label = QLabel("Geeksforgeeks Image View")
# setting minimum width
label.setMinimumWidth(130)
# making label do word wrap
label.setWordWrap(True)
# setting configuration options
pg.setConfigOptions(antialias=True)
# creating image view object
imv = ImageView()
# Create random 3D data set with noisy signals
img = pg.gaussianFilter(np.random.normal(
size=(200, 200)), (5, 5)) * 20 + 100
# setting new axis to image
img = img[np.newaxis, :, :]
# decay data
decay = np.exp(-np.linspace(0, 0.3, 100))[:, np.newaxis, np.newaxis]
# random data
data = np.random.normal(size=(100, 200, 200))
data += img * decay
data += 2
# adding time-varying signal
sig = np.zeros(data.shape[0])
sig[30:] += np.exp(-np.linspace(1, 10, 70))
sig[40:] += np.exp(-np.linspace(1, 10, 60))
sig[70:] += np.exp(-np.linspace(1, 10, 30))
sig = sig[:, np.newaxis, np.newaxis] * 3
data[:, 50:60, 30:40] += sig
# Displaying the data and assign each frame a time value from 1.0 to 3.0
imv.setImage(data, xvals=np.linspace(1., 3., data.shape[0]))
# Set a custom color map
colors = [
(0, 0, 0),
(4, 5, 61),
(84, 42, 55),
(15, 87, 60),
(208, 17, 141),
(255, 255, 255)
]
# color map
cmap = pg.ColorMap(pos=np.linspace(0.0, 1.0, 6), color=colors)
# setting color map to the image view
imv.setColorMap(cmap)
# Creating a grid layout
layout = QGridLayout()
# minimum width value of the label
label.setFixedWidth(130)
# setting this layout to the widget
widget.setLayout(layout)
# adding label in the layout
layout.addWidget(label, 1, 0)
# plot window goes on right side, spanning 3 rows
layout.addWidget(imv, 0, 1, 3, 1)
# setting this widget as central widget of the main window
self.setCentralWidget(widget)
# getting quick min max
value = imv.quickMinMax(data)
# setting text to the label
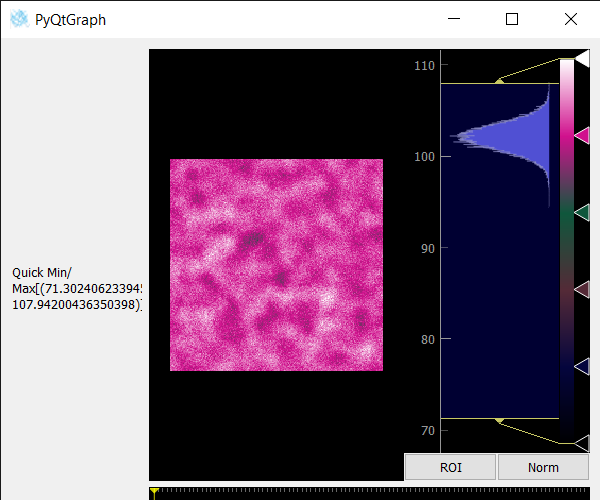
label.setText("Quick Min/Max" + str(value))
# create pyqt5 app
App = QApplication(sys.argv)
# create the instance of our Window
window = Window()
# start the app
sys.exit(App.exec())
Producción:
Publicación traducida automáticamente
Artículo escrito por rakshitarora y traducido por Barcelona Geeks. The original can be accessed here. Licence: CCBY-SA