Matplotlib es una increíble biblioteca de visualización en Python para gráficos 2D de arrays. Matplotlib es una biblioteca de visualización de datos multiplataforma basada en arrays NumPy y diseñada para funcionar con la pila SciPy más amplia.
matplotlib.text.OffsetFrom
La matplotlib.text.OffsetFrom clase es una clase auxiliar a la que se puede llamar para trabajar con Annotation.
Sintaxis: class matplotlib.text.OffsetFrom(artist, ref_coord, unit=’points’)
Parámetro:
- artista: este objeto se utiliza para calcular el desplazamiento. Generalmente es un Artista, un BboxBase o Transform.
- ref_coord: Es una secuencia de longitud 2. Este valor es la ubicación del origen del desplazamiento en fracciones del cuadro delimitador del artista si es un Artista o BboxBase, mientras que el origen del desplazamiento es la transformación aplicada a este valor si el artista es una Transformación.
- unidad : Se utiliza para gestionar las unidades de pantalla a utilizar (píxeles o puntos) para la entrada de compensación.
Métodos de la clase:
- get_unit(self) : Es la unidad de entrada a la transformación utilizada por __call__.
- set_unit(self, unit): Es la unidad de entrada a la transformación utilizada por __call__ donde, el argumento de la unidad está en ‘puntos’ o ‘píxeles’.
Ejemplo 1:
import matplotlib.pyplot as plt
import matplotlib.text

fig, ax = plt.subplots()

ax.plot([5,1], label="Label 1")
ax.plot([3,0], label="Label 2")

legend = ax.legend(loc="upper right")

# Create offset from lower right
# corner of legend box, (1.0,0) is
# the coordinates of the offset point
# in the legend coordinate system
offset = matplotlib.text.OffsetFrom(legend, (1.0, 0.0))

# Create annotation. Top right corner
# located -20 pixels below the offset
# point (lower right corner of legend).
ax.annotate("info_string",
            xy = (0,0),
            size = 14,
            xycoords = 'figure fraction',
            xytext = (0,-20),
            textcoords = offset,
            horizontalalignment = 'right',
            verticalalignment = 'top')

# Draw the canvas for offset to take effect
fig.canvas.draw()

plt.show()
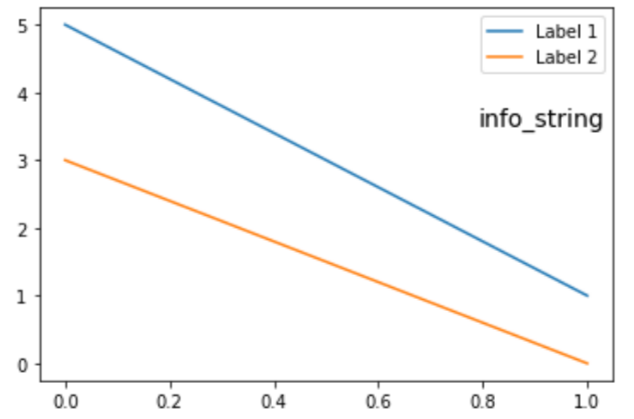
Producción:
Ejemplo 2:
import matplotlib.pyplot as plt
from matplotlib.patches import Ellipse
import numpy as np
from matplotlib.text import OffsetFrom


fig, (ax1, ax2) = plt.subplots(1, 2)

bbox_args = dict(boxstyle ="round", fc ="0.8")
arrow_args = dict(arrowstyle ="->")

# Here we'll demonstrate the extents of the coordinate system and how
# we place annotating text.

ax1.annotate('figure fraction : 0, 0',
             xy =(0, 0),
             xycoords ='figure fraction',
             xytext =(20, 20),
             textcoords ='offset points',
             ha = "left",
             va = "bottom",
             bbox = bbox_args,
             arrowprops = arrow_args)

ax1.annotate('figure fraction : 1, 1',
             xy =(1, 1),
             xycoords ='figure fraction',
             xytext = (-20, -20),
             textcoords ='offset points',
             ha = "right",
             va = "top",
             bbox = bbox_args,
             arrowprops = arrow_args)

ax1.annotate('axes fraction : 0, 0',
             xy = (0, 0),
             xycoords ='axes fraction',
             xytext = (20, 20),
             textcoords ='offset points',
             ha = "left",
             va = "bottom",
             bbox = bbox_args,
             arrowprops = arrow_args)

ax1.annotate('axes fraction : 1, 1',
             xy =(1, 1),
             xycoords ='axes fraction',
             xytext = (-20, -20),
             textcoords ='offset points',
             ha = "right",
             va = "top",
             bbox = bbox_args,
             arrowprops = arrow_args)

# It is also possible to generate
# draggable annotations
an1 = ax1.annotate('Drag me 1', xy =(.5, .7),
                   xycoords ='data',
                   ha ="center", va ="center",
                   bbox = bbox_args,
                   )

an2 = ax1.annotate('Drag me 2', xy =(.5, .5),
                   xycoords = an1,
                   xytext =(.5, .3),
                   textcoords = 'axes fraction',
                   ha = "center",
                   va = "center",
                   bbox = bbox_args,
                   arrowprops = dict(patchB = an1.get_bbox_patch(),
                                   connectionstyle = "arc3, rad = 0.2",
                                   **arrow_args))
an1.draggable()
an2.draggable()

an3 = ax1.annotate('', xy =(.5, .5), xycoords = an2,
                   xytext =(.5, .5), textcoords = an1,
                   ha ="center", va ="center",
                   bbox = bbox_args,
                   arrowprops = dict(patchA = an1.get_bbox_patch(),
                                   patchB = an2.get_bbox_patch(),
                                   connectionstyle ="arc3, rad = 0.2",
                                   **arrow_args))

# Finally we'll show off some more
# complex annotation and placement
text = ax2.annotate('xy =(0, 1)\nxycoords = ("data", "axes fraction")',
                    xy =(0, 1),
                    xycoords = ("data", 'axes fraction'),
                    xytext = (0, -20),
                    textcoords ='offset points',
                    ha = "center",
                    va = "top",
                    bbox = bbox_args,
                    arrowprops = arrow_args)

ax2.annotate('xy =(0.5, 0)\nxycoords = artist',
             xy =(0.5, 0.),
             xycoords = text,
             xytext = (0, -20),
             textcoords = 'offset points',
             ha = "center",
             va = "top",
             bbox = bbox_args,
             arrowprops = arrow_args)

ax2.annotate('xy =(0.8, 0.5)\nxycoords = ax1.transData',
             xy =(0.8, 0.5),
             xycoords = ax1.transData,
             xytext = (10, 10),
             textcoords = OffsetFrom(ax2.bbox, (0, 0), "points"),
             ha = "left",
             va = "bottom",
             bbox = bbox_args,
             arrowprops = arrow_args)

ax2.set(xlim =[-2, 2], ylim =[-2, 2])
plt.show()
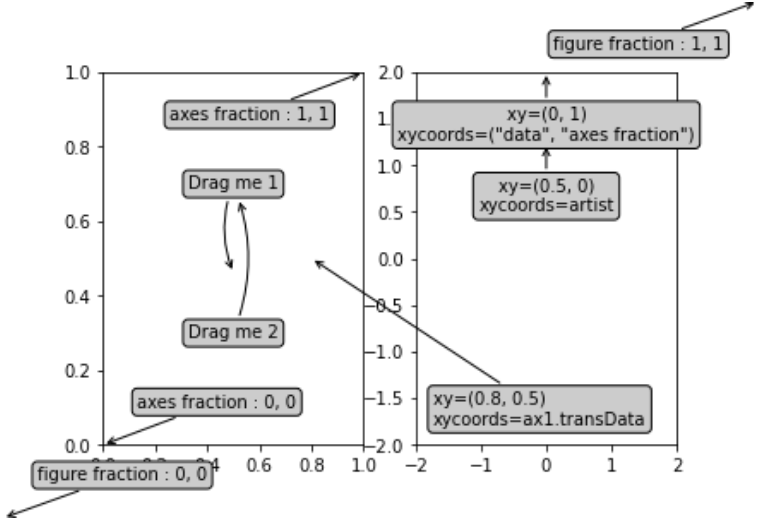
Producción:
Publicación traducida automáticamente
Artículo escrito por RajuKumar19 y traducido por Barcelona Geeks. The original can be accessed here. Licence: CCBY-SA