Prerrequisito: Introducción a Tkinter | Introducción a Matplotlib
Cuando se usa Matplotlib desde el shell de Python, los gráficos se muestran en una ventana predeterminada. Los gráficos se pueden incrustar en muchas interfaces gráficas de usuario como wxpython, pygtk o Tkinter. Estas diversas opciones disponibles como objetivo para el gráfico de salida se denominan ‘ backends ‘. Hay varios módulos disponibles en matplotlib.backend para elegir el backend. Uno de esos módulos es backend_tkagg, que es útil para incrustar gráficos en Tkinter .
Creando la aplicación Tkinter:
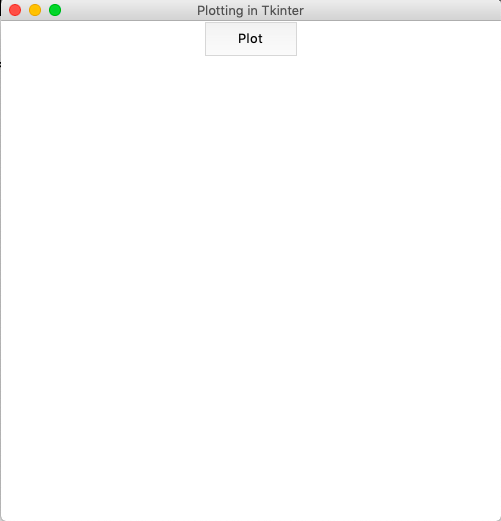
Primero, creemos una aplicación básica de Tkinter con la ventana principal y un botón que se puede usar para mostrar el gráfico.
Python3
# import all classes/methods
# from the tkinter module
from tkinter import *

# The main tkinter window
window = Tk()

# setting the title and
window.title('Plotting in Tkinter')

# setting the dimensions of
# the main window
window.geometry("500x500")

# button that would displays the plot
plot_button = Button(master = window,
                     height = 2,
                     width = 10,
                    text = "Plot")
# place the button
# into the window
plot_button.pack()

# run the gui
window.mainloop()
Producción :

Incrustando la trama:
Primero, necesitamos crear el objeto de figura usando la clase Figure() . Luego, se crea un lienzo Tkinter (que contiene la figura) usando la clase FigureCanvasTkAgg() . Los gráficos de Matplotlib por defecto tienen una barra de herramientas en la parte inferior. Sin embargo, cuando se trabaja con Tkinter , esta barra de herramientas debe estar incrustada en el lienzo por separado usando la clase NavigationToolbar2Tk() .
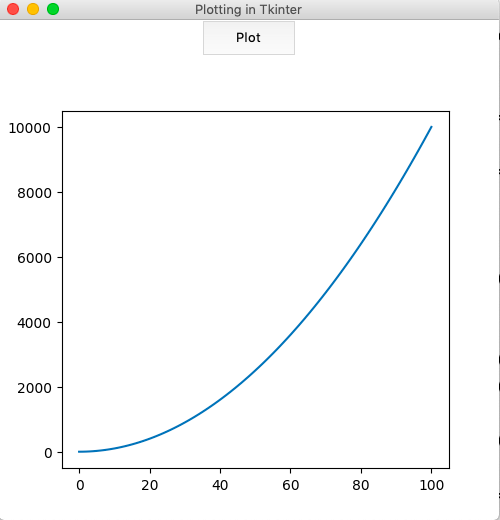
En la implementación a continuación, un gráfico simple para:
![]()
está trazado. La función de trazado está vinculada a un botón que muestra la figura cuando se presiona.
Python3
from tkinter import *
from matplotlib.figure import Figure
from matplotlib.backends.backend_tkagg import (FigureCanvasTkAgg,
NavigationToolbar2Tk)

# plot function is created for
# plotting the graph in
# tkinter window
def plot():

    # the figure that will contain the plot
    fig = Figure(figsize = (5, 5),
                 dpi = 100)

    # list of squares
    y = [i**2 for i in range(101)]

    # adding the subplot
    plot1 = fig.add_subplot(111)

    # plotting the graph
    plot1.plot(y)

    # creating the Tkinter canvas
    # containing the Matplotlib figure
    canvas = FigureCanvasTkAgg(fig,
                               master = window)
    canvas.draw()

    # placing the canvas on the Tkinter window
    canvas.get_tk_widget().pack()

    # creating the Matplotlib toolbar
    toolbar = NavigationToolbar2Tk(canvas,
                                   window)
    toolbar.update()

    # placing the toolbar on the Tkinter window
    canvas.get_tk_widget().pack()

# the main Tkinter window
window = Tk()

# setting the title
window.title('Plotting in Tkinter')

# dimensions of the main window
window.geometry("500x500")

# button that displays the plot
plot_button = Button(master = window,
                     command = plot,
                     height = 2,
                     width = 10,
                     text = "Plot")

# place the button
# in main window
plot_button.pack()

# run the gui
window.mainloop()
Producción :

Publicación traducida automáticamente
Artículo escrito por cosine1509 y traducido por Barcelona Geeks. The original can be accessed here. Licence: CCBY-SA