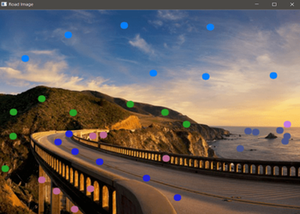
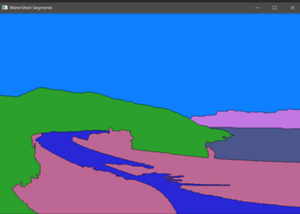
Este artículo analiza cómo podemos detectar contornos dinámicamente al hacer clic en la imagen y asignar diferentes colores a diferentes partes de la imagen. Los contornos son una herramienta muy útil para el análisis de formas y la detección y reconocimiento de objetos. Este programa utiliza las bibliotecas OpenCV , Numpy y Matplotlib . También utiliza un algoritmo OpenCV Watershed incorporado para detectar contornos.
Requisitos
- Python y OpenCV deben estar instalados en la máquina local.
- Instale Jupyter Notebook para una fácil depuración.
- Aquí, el mapa de colores de Matplotlib se usa para obtener diferentes colores. En el ejemplo dado a continuación, usaremos tab10. Puede elegir diferentes mapas de colores. Consulte este sitio para ver los diferentes colores.
Explicación
- Ejecuta el programa.
- Haga clic en la imagen donde desea hacer los contornos.
- Seleccione un color diferente para una parte diferente de la imagen presionando números del cero al nueve. (Un número para un color)
A continuación se muestra la implementación.
Python3
# Import modules
import cv2
import numpy as np
import matplotlib.pyplot as plt
from matplotlib import cm

# Upload the image in the same directory and then run the code
# If image not found you may get an error
# Reading Image
road = cv2.imread('road_image.jpg')

# Making Copy of Image
road_copy = np.copy(road)

# Creating two black image of same size as original image
marker_image = np.zeros(road.shape[:2], dtype=np.int32)
segments = np.zeros(road.shape, dtype=np.uint8)

# Function to return tuple of colors
def create_rgb(i):
    x = np.array(cm.tab10(i))[:3]*255
    return tuple(x)


# Storing Colors
colors = []

# One color for each single digit
for i in range(10):
    colors.append(create_rgb(i))

# Global Variables
# Color Choices
# Number of markers
no_markers = 10

# Current markers
current_marker = 1

# Flag
marks_updated = False

# CALLBACK FUNCTION
def mouse_callback(event, x, y, flags, param):
    global marks_updated

    if event == cv2.EVENT_LBUTTONDOWN:

        # TRACKING FOR MARKERS
        cv2.circle(marker_image, (x, y), 5, (current_marker), -1)

        # DISPLAY ON USER IMAGE
        cv2.circle(road_copy, (x, y), 5, colors[current_marker], -1)

        marks_updated = True


# Naming the window and setting call back function to it
cv2.namedWindow('Road Image')
cv2.setMouseCallback('Road Image', mouse_callback)

while True:

    # Show the 2 windows
    cv2.imshow('WaterShed Segments', segments)
    cv2.imshow('Road Image', road_copy)

    # Close everything if Esc is pressed
    k = cv2.waitKey(1)
    if k == 27:
        break

    # Clear all colors and start over if 'c' is pressed
    elif k == ord('c'):
        road_copy = road.copy()
        marker_image = np.zeros(road.shape[0:2], dtype=np.int32)
        segments = np.zeros(road.shape, dtype=np.uint8)

    # If a number 0-9 is chosen index the color
    elif k > 0 and chr(k).isdigit():

        # chr converts to printable digit
        current_marker = int(chr(k))

    # If we clicked somewhere, call the watershed
    # algorithm on our chosen markers
    if marks_updated:
        marker_image_copy = marker_image.copy()
        cv2.watershed(road, marker_image_copy)
        segments = np.zeros(road.shape, dtype=np.uint8)

        for color_ind in range(no_markers):

            # COLORING SEGMENTS
            segments[marker_image_copy == (color_ind)] = colors[color_ind]

        marks_updated = False

# Destroy all the windows at the end
cv2.destroyAllWindows()
Producción:
Este código abrirá dos ventanas. Uno con la imagen original y otro negro. Al hacer clic en la imagen original, se crearán pequeños círculos en ella y los contornos se mostrarán en la imagen negra. (Presione los números del 0 al 9 para cambiar los colores y producir un gráfico de contorno diferente).

Imagen original

Imagen procesada
Publicación traducida automáticamente
Artículo escrito por adityapande88 y traducido por Barcelona Geeks. The original can be accessed here. Licence: CCBY-SA