Matplotlib es una biblioteca en Python y es una extensión matemática numérica para la biblioteca NumPy. Es una biblioteca de visualización increíble en Python para gráficos 2D de arrays y se utiliza para trabajar con la pila SciPy más amplia.
función matplotlib.axis.Axis.axis_date()
La función Axis.axis_date() en el módulo de eje de la biblioteca matplotlib se usa para configurar marcas de eje y etiquetas que tratan los datos a lo largo de este eje como fechas.
Sintaxis: Axis.axis_date(self, tz=Ninguno)
Parámetros: este método acepta los siguientes parámetros.
- tz : este parámetro es la zona horaria utilizada para crear etiquetas de fecha.
Valor devuelto : este método no devuelve ningún valor.
Los siguientes ejemplos ilustran la función matplotlib.axis.Axis.axis_date() en matplotlib.axis:
Ejemplo 1:
Python3
# Implementation of matplotlib function
from matplotlib.axis import Axis
import datetime as dt
import matplotlib.pyplot as plt
from matplotlib.dates import DateFormatter, MinuteLocator

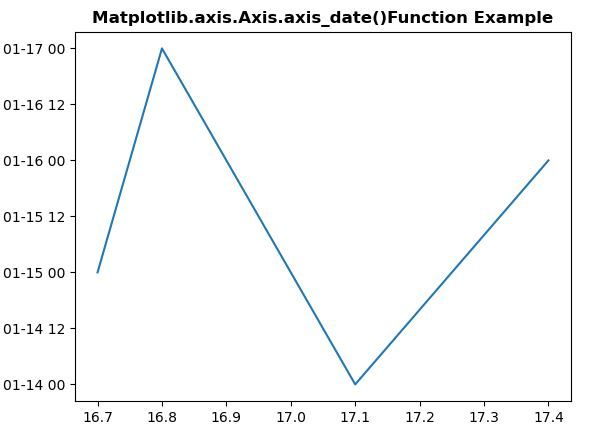
x = [16.7,16.8,17.1,17.4]
y = [15,17,14,16]
plt.plot(x, y)

plt.gca().yaxis.axis_date()

plt.title("Matplotlib.axis.Axis.axis_date()\
Function Example", fontsize = 12, fontweight ='bold')

plt.show()
Producción:

Ejemplo 2:
Python3
# Implementation of matplotlib function
from matplotlib.axis import Axis
from datetime import datetime
import matplotlib.pyplot as plt
from matplotlib.dates import (
    DateFormatter, AutoDateLocator, AutoDateFormatter, datestr2num
)


days = [
    '30/01/2019',
    '31/01/2019',
    '01/02/2019',
    '02/02/2019',
    '03/02/2019',
    '04/02/2019'
]
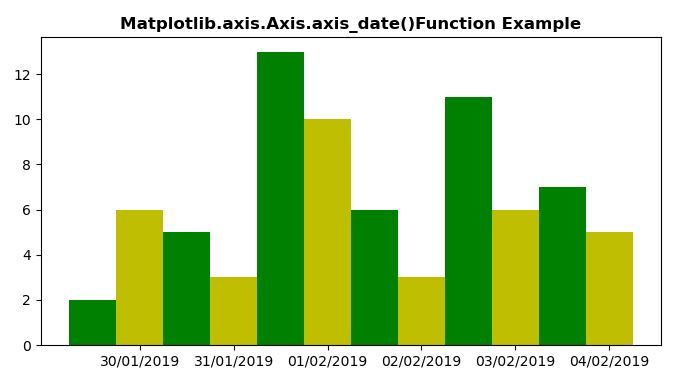
data1 = [2, 5, 13, 6, 11, 7]
data2 = [6, 3, 10, 3, 6, 5]

z = datestr2num([
    datetime.strptime(day, '%d/%m/%Y').strftime('%m/%d/%Y')
    for day in days
])

r = 0.25

figure = plt.figure(figsize =(8, 4))
axes = figure.add_subplot(111)

axes.bar(z - r, data1, width = 2 * r,
         color ='g', align ='center',
         tick_label = days)
axes.bar(z + r, data2, width = 2 * r,
         color ='y', align ='center',
         tick_label = days)

axes.xaxis.axis_date()

plt.title("Matplotlib.axis.Axis.axis_date()\
Function Example", fontsize = 12, fontweight ='bold')

plt.show()
Producción:

Publicación traducida automáticamente
Artículo escrito por SHUBHAMSINGH10 y traducido por Barcelona Geeks. The original can be accessed here. Licence: CCBY-SA