PyQtGraph es una biblioteca Python de gráficos e interfaz de usuario para funcionalidades comúnmente requeridas en aplicaciones científicas y de diseño. Proporciona gráficos rápidos e interactivos para mostrar datos (gráficos, video, etc.). Un gráfico de líneas es un tipo de gráfico que muestra información como una serie de puntos de datos comúnmente conocidos como marcadores, conectados por segmentos de línea recta. Un diagrama de dispersión usa puntos para representar valores para dos variables numéricas diferentes. Es un tipo de gráfico, dibujado usando coordenadas cartesianas para mostrar valores de dos variables típicamente para un conjunto de datos.
Cuando creamos un gráfico de líneas o un gráfico de diagrama de dispersión, los puntos que representan algunos datos deben resaltarse con ciertos símbolos, por defecto es un círculo redondo, pero esto se puede modificar según sea necesario. Pyqtgraph ofrece un total de 12 símbolos que se pueden usar para cambiar el símbolo según sea necesario.
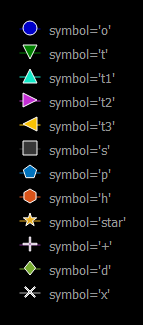
A continuación se muestra la lista de los símbolos disponibles en este módulo:
- o : Símbolo predeterminado, símbolo de círculo redondo
- t : Triángulo apuntando hacia abajo símbolo
- t1 : Triángulo apuntando hacia arriba símbolo
- t2 : Triángulo que señala el símbolo del lado derecho
- t3 : Triángulo que señala el símbolo del lado izquierdo
- s : Símbolo cuadrado
- p : símbolo del Pentágono
- h : símbolo hexagonal
- estrella : símbolo de estrella
- + : símbolo más
- d : símbolo del prisma
- x : Símbolo de cruz
Así es como aparecen en la pantalla de salida:
Podemos crear una ventana de trazado con la ayuda de los comandos que se indican a continuación:
plt = pg.plot()
Para implementar el concepto explicado anteriormente, se pueden seguir los siguientes pasos:
- Importar módulos pyqtgraph, pyqt5 y numpy
- Crear clase de ventana principal
- Crear un objeto de ventana de trazado
- Agregar leyenda a la ventana de trazado
- Cree 12 líneas que tengan diferentes puntos para que no se crucen entre sí y dividan diferentes símbolos y colores.
- Agregue la ventana de trazado y otro widget como etiqueta al diseño de cuadrícula
- Establecer el widget de diseño de cuadrícula como el widget central de la ventana principal
Ejemplo:
Python3
# importing Qt widgets
from PyQt5.QtWidgets import *

# importing system
import sys

# importing numpy as np
import numpy as np

# importing pyqtgraph as pg
import pyqtgraph as pg
from PyQt5.QtGui import * from PyQt5.QtCore import * from collections import namedtuple


class Window(QMainWindow):

    def __init__(self):
        super().__init__()

        # setting title
        self.setWindowTitle("PyQtGraph")

        # setting geometry
        self.setGeometry(100, 100, 800, 500)


        # icon
        icon = QIcon("skin.png")

        # setting icon to the window
        self.setWindowIcon(icon)

        # calling method
        self.UiComponents()

        # showing all the widgets
        self.show()

    # method for components
    def UiComponents(self):

        # creating a widget object
        widget = QWidget()

        # text
        text = "Geeksforgeeks Different Symbols"

        # creating a label
        label = QLabel(text)

        # setting minimum width
        label.setMinimumWidth(130)

        # making label do word wrap
        label.setWordWrap(True)

        # setting pyqtgraph configuration
        pg.setConfigOptions(antialias = True)

        # creating a plot window
        plot = pg.plot()

        # adding legend to the plot window
        plot.addLegend()

        # plot the line1 with symbol o
        # having color blue
        line1 = plot.plot([1, 1, 1, 1, 1], pen =(0, 0, 200), symbolBrush =(0, 0, 200),
                          symbolPen ='w', symbol ='o', symbolSize = 14, name ="symbol ='o'")

        # plot the line2 with symbol t
        # having color green
        line2 = plot.plot([2, 2, 2, 2, 2], pen =(0, 128, 0), symbolBrush =(0, 128, 0),
                          symbolPen ='w', symbol ='t', symbolSize = 14, name ="symbol ='t'")

        # plot the line3 with symbol t1
        # having color bluegreen
        line3 = plot.plot([3, 3, 3, 3, 3], pen =(19, 234, 201), symbolBrush =(19, 234, 201),
                          symbolPen ='w', symbol ='t1', symbolSize = 14, name ="symbol ='t1'")

        # plot the line4 with symbol t2
        # having color purple
        line4 = plot.plot([4, 4, 4, 4, 4], pen =(195, 46, 212), symbolBrush =(195, 46, 212),
                          symbolPen ='w', symbol ='t2', symbolSize = 14, name ="symbol ='t2'")

        # plot the line5 with symbol t3
        # having color brownish
        line5 = plot.plot([5, 5, 5, 5, 5], pen =(250, 194, 5), symbolBrush =(250, 194, 5),
                          symbolPen ='w', symbol ='t3', symbolSize = 14, name ="symbol ='t3'")

        # plot the line6 with symbol s
        # having color grey
        line6 = plot.plot([6, 6, 6, 6, 6], pen =(54, 55, 55), symbolBrush =(55, 55, 55), symbolPen ='w', symbol ='s', symbolSize = 14,
                  name ="symbol ='s'")

        # plot the line7 with symbol p
        # having color sky blue
        line7 = plot.plot([7, 7, 7, 7, 7], pen =(0, 114, 189), symbolBrush =(0, 114, 189),
                         symbolPen ='w', symbol ='p', symbolSize = 14, name ="symbol ='p'")

        # plot the line8 with symbol h
        # having color orange
        line8 = plot.plot([8, 8, 8, 8, 8], pen =(217, 83, 25), symbolBrush =(217, 83, 25),
                          symbolPen ='w', symbol ='h', symbolSize = 14, name ="symbol ='h'")

        # plot the line9 with symbol star
        # having yellow color
        line9 = plot.plot([9, 9, 9, 9, 9], pen =(237, 177, 32), symbolBrush =(237, 177, 32),
                          symbolPen ='w', symbol ='star', symbolSize = 14, name ="symbol ='star'")

        # plot the line10 with symbol +
        # having bluish color
        line10 = plot.plot([10, 10, 10, 10, 10], pen =(126, 47, 142), symbolBrush =(126, 47, 142),
                           symbolPen ='w', symbol ='+', symbolSize = 14, name ="symbol ='+'")

        # plot the line11 with symbol d
        # having greenish color
        line11 = plot.plot([11, 11, 11, 11, 11], pen =(119, 172, 48), symbolBrush =(119, 172, 48),
                           symbolPen ='w', symbol ='d', symbolSize = 14, name ="symbol ='d'")

        # plot the line12 with symbol x
        # having off white color
        line12 = plot.plot([12, 12, 12, 12, 12], pen =(180, 180, 180), symbolBrush =(180, 180, 180),
                           symbolPen ='w', symbol ='x', symbolSize = 14, name ="symbol ='x'")

        # setting x-axis range
        plot.setXRange(-3, 4)

        # Creating a grid layout
        layout = QGridLayout()

        # minimum width value of the label
        label.setMinimumWidth(130)

        # setting this layout to the widget
        widget.setLayout(layout)

        # adding label in the layout
        layout.addWidget(label, 1, 0)

        # plot window goes on right side, spanning 3 rows
        layout.addWidget(plot, 0, 1, 3, 1)

        # setting this widget as central widget of the main window
        self.setCentralWidget(widget)


# create pyqt5 app
App = QApplication(sys.argv)

# create the instance of our Window
window = Window()

# start the app
sys.exit(App.exec())
Producción :
Publicación traducida automáticamente
Artículo escrito por rakshitarora y traducido por Barcelona Geeks. The original can be accessed here. Licence: CCBY-SA