En este artículo veremos cómo podemos agregar widgets Qt con el gráfico de barras en el módulo PyQtGraph. PyQtGraph es una biblioteca de interfaz de usuario y gráficos para Python que proporciona la funcionalidad comúnmente requerida en el diseño y las aplicaciones científicas. Sus objetivos principales son proporcionar gráficos rápidos e interactivos para mostrar datos (gráficos, videos, etc.) y, en segundo lugar, proporcionar herramientas para ayudar en el desarrollo rápido de aplicaciones (por ejemplo, árboles de propiedades como los que se usan en Qt Designer). Un gráfico de barras o gráfico de barras es una tabla o gráfico que presenta datos categóricos con barras rectangulares con alturas o longitudes proporcionales a los valores que representan. Las barras se pueden trazar vertical u horizontalmente. Un gráfico de barras verticales a veces se denomina gráfico de columnas.
Podemos crear una ventana de trazado y un gráfico de barras con la ayuda de los comandos que se indican a continuación.
# creating a pyqtgraph plot window
window = pg.plot()

# creating a bar graph of green color
bargraph = pg.BarGraphItem(x=x, height=y1, width=0.6, brush='g')
Para hacer esto, tenemos que hacer lo siguiente
1. Importar los QWidgets desde PyQt5
2. Importar el módulo pyqtgraph
3. Crear la clase de ventana principal
4. Agregar varias características a la clase de ventana principal
5. Crear diferentes tipos de QtWidgets
6 Cree una ventana de trazado en la que se agregue un gráfico de barras
7. Cree un diseño de cuadrícula y agréguele diferentes widgets y una ventana de
trazado 8. Establezca el widget de diseño como el widget central de la ventana
A continuación se muestra la implementación.
Python3
# importing Qt widgets
from PyQt5.QtWidgets import * import sys

# importing pyqtgraph as pg
import pyqtgraph as pg


class Window(QMainWindow):

    def __init__(self):
        super().__init__()

        # setting title
        self.setWindowTitle("PyQtGraph")

        # setting geometry
        self.setGeometry(100, 100, 600, 500)

        # calling method
        self.UiComponents()

        # showing all the widgets
        self.show()

    # method for components
    def UiComponents(self):

        # creating a widget object
        widget = QWidget()

        # creating a push button object
        btn = QPushButton('Push Button')

        # creating a line edit widget
        text = QLineEdit("Line Edit")

        # creating a check box widget
        check = QCheckBox("Check Box")

        # creating a plot window
        plot = pg.plot()

        # create list for y-axis
        y1 = [5, 5, 7, 10, 3, 8, 9, 1, 6, 2]

        # create horizontal list i.e x-axis
        x = [1, 2, 3, 4, 5, 6, 7, 8, 9, 10]

        # create pyqt5graph bar graph item
        # with width = 0.6
        # with bar colors = green
        bargraph = pg.BarGraphItem(x = x, height = y1, width = 0.6, brush ='g')

        # add item to plot window
        # adding bargraph item to the plot window
        plot.addItem(bargraph)

        # Creating a grid layout
        layout = QGridLayout()

        # setting this layout to the widget
        widget.setLayout(layout)

        # adding widgets in the layout in their proper positions
        # button goes in upper-left
        layout.addWidget(btn, 0, 0)

        # text edit goes in middle-left
        layout.addWidget(text, 1, 0)

        # check box widget goes in bottom-left
        layout.addWidget(check, 3, 0)

        # plot window goes on right side, spanning 3 rows
        layout.addWidget(plot, 0, 1, 3, 1)

        # setting this widget as central widget of the main window
        self.setCentralWidget(widget)


# create pyqt5 app
App = QApplication(sys.argv)

# create the instance of our Window
window = Window()

# start the app
sys.exit(App.exec())
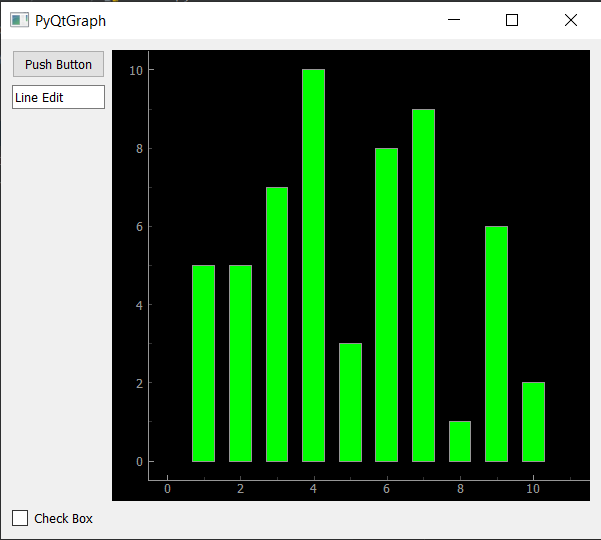
Producción :
Publicación traducida automáticamente
Artículo escrito por rakshitarora y traducido por Barcelona Geeks. The original can be accessed here. Licence: CCBY-SA