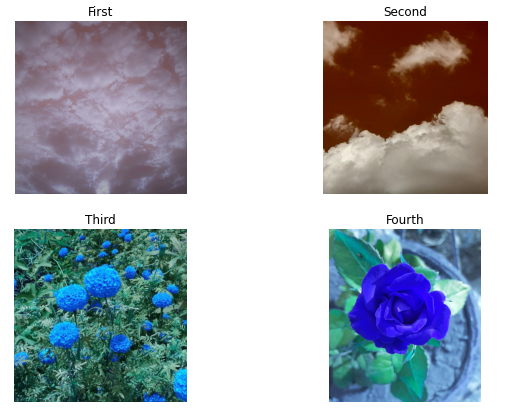
La forma más fácil de mostrar varias imágenes en una figura es usar los métodos figure() , add_subplot() e imshow() de Matplotlib. El enfoque que se usa para seguir es primero iniciar el objeto fig llamando a fig=plt.figure() y luego agregar un objeto de ejes a la figura llamando al método add_subplot(). Luego mostrará la imagen usando el método imshow().
Sintaxis: add_subplot(filas, columnas, i)
Aquí filas y columnas son el número total de filas y columnas en la figura e i es la posición en la que se debe colocar la nueva subparcela.
Pasos:
- Importar bibliotecas requeridas
- crea una figura
- Establecer valores de variables de filas y columnas
- Leer imágenes
- Agregar subtrama y mostrar la imagen una por una
Considere las siguientes imágenes utilizadas como entrada:

Imagen1

Imagen2

Imagen3

Imagen4
A continuación se muestra la implementación:
Python3
# code for displaying multiple images in one figure

#import libraries
import cv2
from matplotlib import pyplot as plt

# create figure
fig = plt.figure(figsize=(10, 7))

# setting values to rows and column variables
rows = 2
columns = 2

# reading images
Image1 = cv2.imread('Image1.jpg')
Image2 = cv2.imread('Image2.jpg')
Image3 = cv2.imread('Image3.jpg')
Image4 = cv2.imread('Image4.jpg')

# Adds a subplot at the 1st position
fig.add_subplot(rows, columns, 1)

# showing image
plt.imshow(Image1)
plt.axis('off')
plt.title("First")

# Adds a subplot at the 2nd position
fig.add_subplot(rows, columns, 2)

# showing image
plt.imshow(Image2)
plt.axis('off')
plt.title("Second")

# Adds a subplot at the 3rd position
fig.add_subplot(rows, columns, 3)

# showing image
plt.imshow(Image3)
plt.axis('off')
plt.title("Third")

# Adds a subplot at the 4th position
fig.add_subplot(rows, columns, 4)

# showing image
plt.imshow(Image4)
plt.axis('off')
plt.title("Fourth")
Producción:
Publicación traducida automáticamente
Artículo escrito por patildhanu4111999 y traducido por Barcelona Geeks. The original can be accessed here. Licence: CCBY-SA
