D3 significa Documentos basados en datos. Es una biblioteca JavaScript de código abierto que se usa para crear visualizaciones de datos interactivas en el navegador usando HTML, SVG y CSS. La gran cantidad de datos que se generan en el mundo actual son muy difíciles de almacenar y analizar. Las representaciones visuales de datos son los medios más efectivos para transmitir la información almacenada y D3 brinda la facilidad y flexibilidad para crear estas visualizaciones de datos.
Una forma sencilla de hacer que cualquier gráfico SVG o D3.js responda. Aquí usaremos D3.js para hacer que el gráfico de barras responda.
Enfoque para crear una visualización d3.js receptiva: veamos algunos de los conceptos importantes que hemos aprendido, que se implementarán a través del código HTML a continuación.
- Seleccione un elemento para realizar la operación.
d3.select("body");
- Use el método .append() para agregar un elemento.
var svg = d3.select("body").append("svg");
- set.attr() se usa para establecer el atributo (alto/ancho)
svg.attr({"width":500, "height":500});
- El último paso es agregar los datos a DOM.
var data_values = [15, 33, 20, 90, 10, 55, 60, 75, 58, 12];

// Create rectangles
var bars = svg.selectAll("rect")
.data(data_values)
.enter()
.append("rect")
.attr("width", "25px")
.attr("height", function(d){ return d; });
- Ahora, para hacer que el gráfico responda, reemplace el alto y el ancho establecidos del gráfico, con un atributo viewBox que use los mismos valores de alto y ancho.
.attr("viewBox", `0 0 300 600`)
- El tamaño del gráfico está predefinido con una altura de 300 y un ancho de 600.
const svg = d3
.select("#chart")
.append("svg")
.attr("height", 300)
.attr("width", 600);
Ejemplo:
HTML
<!DOCTYPE html>
<html>

<head>
    <title>
        What is the best way to make a d3.js
        visualization layout responsive?
    </title>

    <style>
        #chart {
            background: steelblue;
            border: 1px solid black;
        }

        rect {
            fill: magenta;
        }
    </style>


</head>

<body>
    <div id="chart"></div>
    <script src='https://d3js.org/d3.v5.min.js'></script>
    <script id="rendered-js">
        const margin = {
            top: 10,
            right: 20,
            bottom: 30,
            left: 30
        };

        // Dimensions: 400 x 400
        // used for the initial rendering
        // width to height proportion
        // its preserved as the chart is resized
        const width = 600 - margin.left - margin.right;
        const height = 300 - margin.top - margin.bottom;
        const data = [15, 33, 20, 90, 10, 55, 60, 75, 58, 12];

        const xScale = d3.scaleBand().
        padding(0.2).
        domain(data).
        range([0, width]);

        const yScale = d3.scaleLinear().
        domain([0, 100]).
        range([height, 0]);

        const svg = d3.select('#chart').
        append('svg').
        attr('width', width + margin.left + margin.right).
        attr('height', height + margin.top + margin.bottom).
        call(responsivefy) // Call responsivefy to make the chart responsive
            .append('g').
        attr('transform', `translate(${margin.left}, ${margin.top})`);

        svg.selectAll('rect').
        data(data).
        enter().
        append('rect').
        attr('x', d => xScale(d)).
        attr('y', d => yScale(d)).
        attr('width', d => xScale.bandwidth()).
        attr('height', d => height - yScale(d));

        svg.append('g').call(d3.axisLeft(yScale));

        svg.append('g').
        attr('transform', `translate(0, ${height})`).
        call(d3.axisBottom(xScale));

        function responsivefy(svg) {

            // Container is the DOM element, svg is appended.
            // Then we measure the container and find its
            // aspect ratio.
            const container = d3.select(svg.node().parentNode),
                width = parseInt(svg.style('width'), 10),
                height = parseInt(svg.style('height'), 10),
                aspect = width / height;

            // Add viewBox attribute to set the value to initial size
            // add preserveAspectRatio attribute to specify how to scale
            // and call resize so that svg resizes on page load
            svg.attr('viewBox', `0 0 ${width} ${height}`).
            attr('preserveAspectRatio', 'xMinYMid').
            call(resize);

            d3.select(window).on('resize.' + container.attr('id'), resize);

            function resize() {
                const targetWidth = parseInt(container.style('width'));
                svg.attr('width', targetWidth);
                svg.attr('height', Math.round(targetWidth / aspect));
            }
        }
    </script>
</body>

</html>
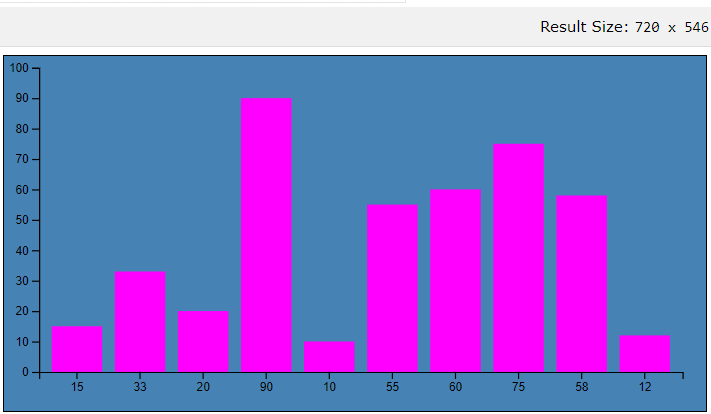
Salida: el gráfico creado cambia de tamaño cuando se cambia el tamaño de la ventana, en lugar de cortar el borde del gráfico:
- Dimensión de pantalla 720*546

- Dimensión de pantalla 590*546

- Dimensión de pantalla 330*546

Publicación traducida automáticamente
Artículo escrito por Pritesh Ranjan 1 y traducido por Barcelona Geeks. The original can be accessed here. Licence: CCBY-SA