Matplotlib es el paquete más popular y listo para Python que se usa para visualizar los datos. Usamos matplotlib para trazar tablas, gráficos y figuras de alta calidad.
función matplotlib.pyplot.semilogy()
La función matplotlib.pyplot.semilogy() en el módulo pyplot de la biblioteca matplotlib se usa para hacer un gráfico con escala de registro en el eje y.
Sintaxis: matplotlib.pyplot.semilogy(*args, **kwargs)
Parámetros: Este método acepta los siguientes parámetros que se describen a continuación:
- basey: este parámetro es la base del logaritmo y y es opcional con el valor predeterminado 10 .
- subsy: este parámetro es la secuencia de ubicación de los ticks y menores y es opcional.
- nonposy: este parámetro es un valor no positivo en y que se puede enmascarar como no válido o recortar a un número positivo muy pequeño.
Devoluciones: Esto devuelve lo siguiente:
- líneas: Esto devuelve la lista de objetos Line2D que representan los datos trazados.
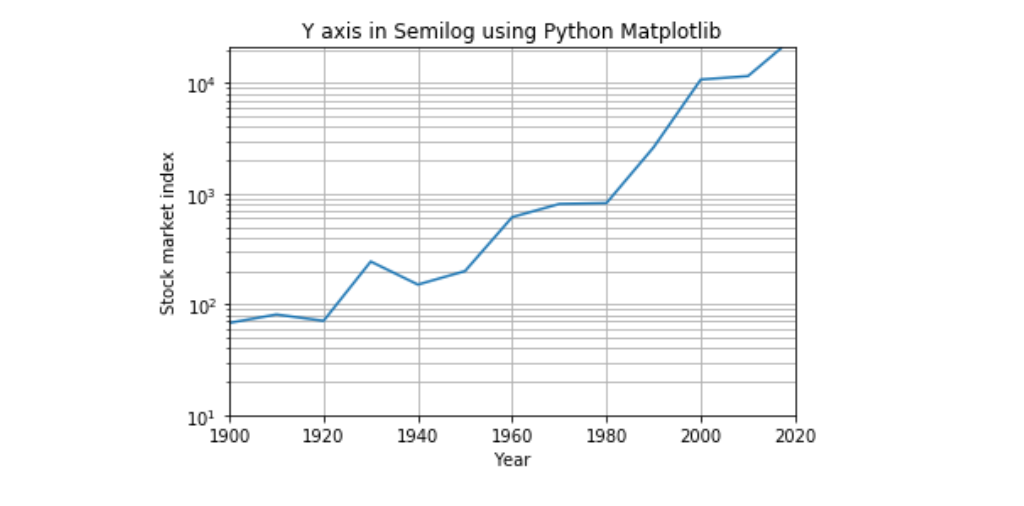
Los siguientes ejemplos ilustran la función matplotlib.pyplot.semilogy() en matplotlib.pyplot:
Ejemplo #1:
# importing necessary libraries
import matplotlib.pyplot as plot
import numpy as np

# Year data for the semilogy plot
years = [1900, 1910, 1920, 1930, 1940, 1950,
         1960, 1970, 1980, 1990, 2000, 2010,
         2017]

# index data - taken at end of every
# decade - for the semilogy plot
indexValues = [68, 81, 71, 244, 151, 200, 615,
               809, 824, 2633, 10787, 11577,
               20656]

# Display grid
plot.grid(True, which ="both")

# Linear X axis, Logarithmic Y axis
plot.semilogy(years, indexValues )

plot.ylim([10, 21000])

plot.xlim([1900, 2020])

# Provide the title for the semilogy plot
plot.title('Y axis in Semilogy using Python Matplotlib')

# Give x axis label for the semilogy plot
plot.xlabel('Year')

# Give y axis label for the semilogy plot
plot.ylabel('Stock market index')

# Display the semilogy plot
plot.show()
Producción:
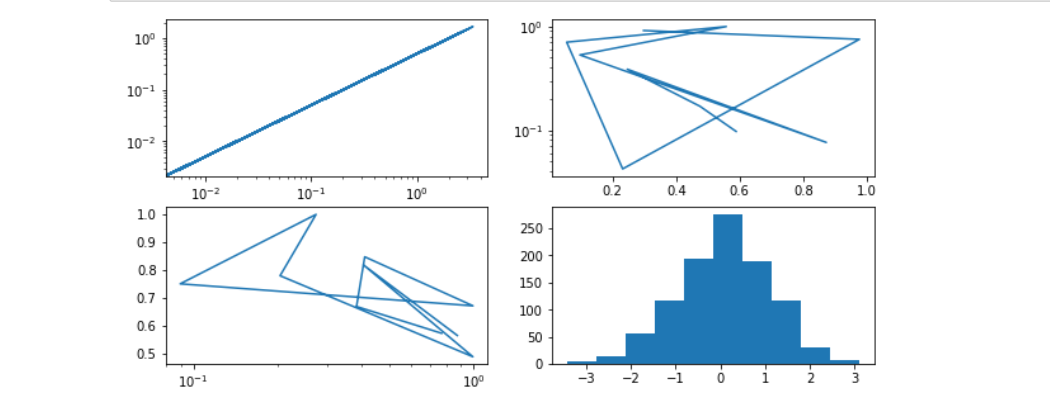
Ejemplo #2:
# importing necessary libraries
import matplotlib.pyplot as plt
import numpy as np


fig, ax = plt.subplots(nrows = 2,
                      ncols = 2,
                      figsize =(10, 5))
x = np.random.randn(1000)

# Plot to each different index
ax[0, 0].loglog(x, x / 2);
ax[0, 1].semilogy(np.random.random(10), np.random.random(10));
ax[1, 0].semilogx(np.random.random(10), np.random.random(10));
ax[1, 1].hist(np.random.randn(1000));
Producción:
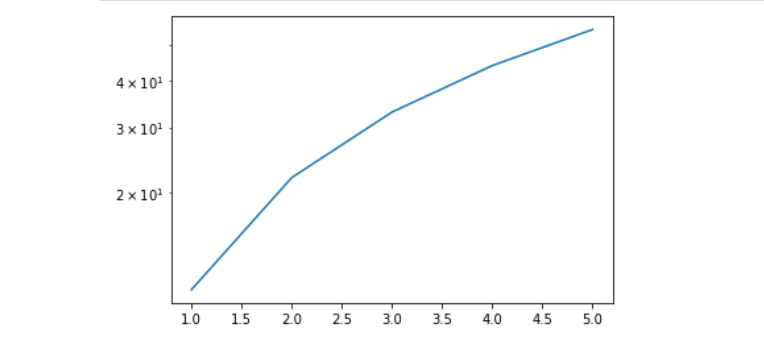
Ejemplo #3:
# importing necessary libraries
import matplotlib.pyplot as plt
import numpy as np


x = [1, 2, 3, 4, 5]
y = [11, 22, 33, 44, 55]

fig, ax = plt.subplots()
ax.semilogy(x, y);
Producción:
Publicación traducida automáticamente
Artículo escrito por yogesh_pandey y traducido por Barcelona Geeks. The original can be accessed here. Licence: CCBY-SA