En JavaScript, es posible mostrar hasta 10 5 usando un ciclo simple. Esto también depende de la capacidad del navegador para ejecutar un bucle tan grande con una complejidad enorme. La página se bloquea cuando se le da una tarea tan grande al navegador. El siguiente código es un ejemplo de cómo podemos llenar una tabla de 10 5 filas.
Ejemplo 1: este ejemplo mostrará cómo podemos llenar una tabla con 10 5 filas usando un código JavaScript simple.
<!DOCTYPE html>
<html>

<head>
    <style>
        table {
            width: 100%;
        }

        table,
        th,
        td {
            border: 1px solid black;
            border-collapse: collapse;
        }

        th,
        td {
            padding: 15px;
            text-align: left;
        }

        table#t01 tr:nth-child(even) {
            background-color: #eee;
        }

        table#t01 tr:nth-child(odd) {
            background-color: #fff;
        }

        table#t01 th {
            background-color: black;
            color: white;
        }
    </style>
</head>

<body>
    <br>

    <table id="t01">
        <tr>
            <th>Counting</th>
            <th>Alphabets</th>
        </tr>
        <script>
            var k = 97;
            for (var j = 1; j <= 100000; j++) {
                if (k == 123)
                    k = 97;
                var string = String.fromCharCode(k);
                document.write(" <tr><td>" + (j) + "</td><td>"
                               + string + "</td></tr>");
                k++;
            }
        </script>
    </table>

</body>

</html>
Producción: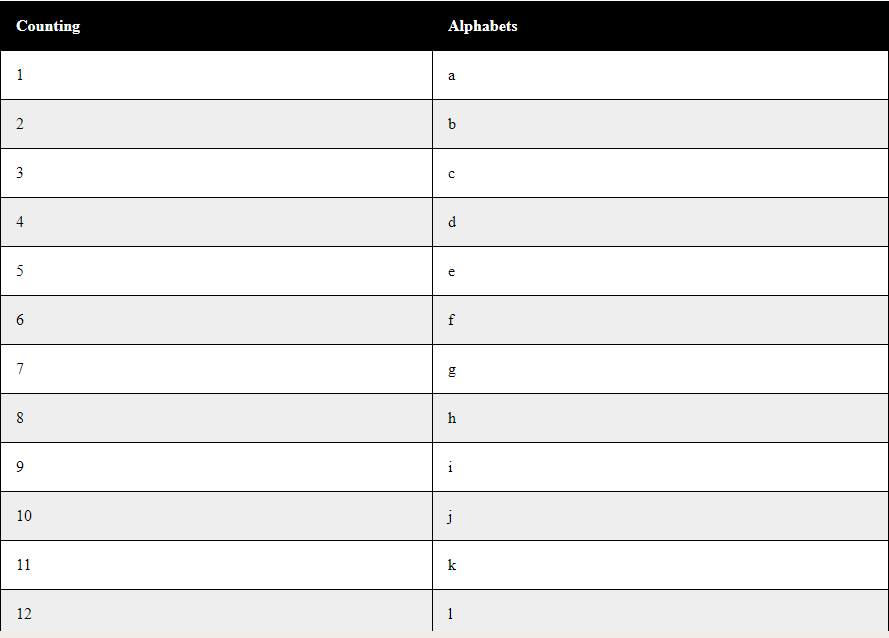
Rendimiento con 1 millón de filas
Para realizar una tarea tan pesada, importaremos una API creada por shield UI. Es una API liviana para cargar cuadrículas grandes que en realidad carga las cuadrículas en tiempo real, es decir, a medida que nos desplazamos hacia abajo en la tabla y, por lo tanto, disminuye la carga en el navegador en ese momento.
Ahora realicemos la misma operación para 1 millón de filas, es decir, 10 6 filas. El siguiente código cargará 1 millón de filas en tiempo real.
Ejemplo:
<!DOCTYPE html>
<html lang="en">

<head>
    <meta charset="utf-8" />
    <title>1 Million Rows Demo</title>
    <link id="themecss"
          rel="stylesheet"
          type="text/css"
          href=
"//www.shieldui.com/shared/components/latest/css/light/all.min.css" />
    <script type="text/javascript"
            src=
"//www.shieldui.com/shared/components/latest/js/jquery-1.11.1.min.js">
  </script>
    <script type="text/javascript"
            src=
"//www.shieldui.com/shared/components/latest/js/shieldui-all.min.js">
  </script>
</head>

<body class="theme-light">
    <div id="grid" style="margin-bottom: -500px;"></div>
    <script type="text/javascript">
        $(function() {
            var grid = new shield.DataSource({
                remote: {
                    operations: ["skip", "take"],
                    read: function(params, success, error) {
                        var skip = grid.skip || 0,
                            take = grid.take || 20,
                            data = [],
                            k = 96;

                        for (var i = skip; i < skip + take; i++) {
                            k++;
                            var row = {};
                            for (var j = 1; j < 3; j++) {
                                row["Counting"] = i + 1;
                                if (k == 123)
                                    k = 97;
                                var string = String.fromCharCode(k);
                                row["Alphabets"] = string;
                            }
                            data.push(row);
                        }
                        success({
                            data: data,
                            total: 1000000
                        });
                    }
                },
                schema: {
                    data: "data",
                    total: "total"
                }
            });
            $("#grid").shieldGrid({
                dataSource: grid,
                height: 400,
                scrolling: {
                    virtual: true
                },
                columns: (function() {
                    var cols = [];

                    cols.push({
                        field: "Counting",
                        width: 140
                    });

                    cols.push({
                        field: "Alphabets",
                        width: 140
                    });
                    return cols;
                })()
            });
        });
    </script>
</body>

</html>
Producción: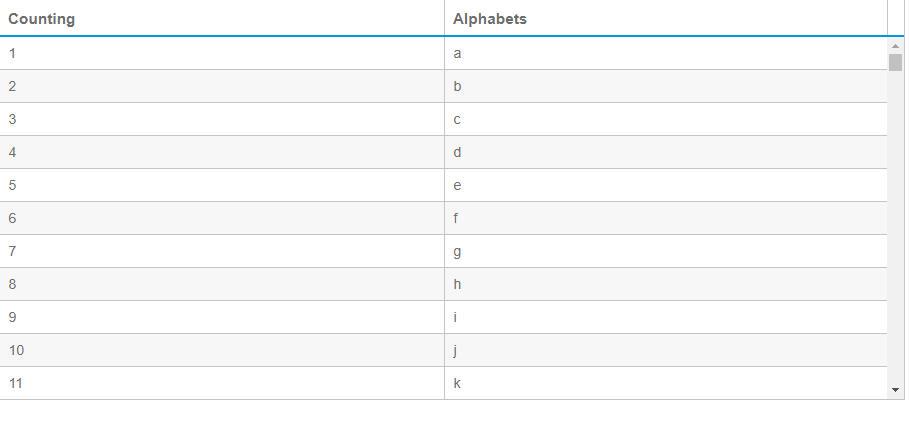
Publicación traducida automáticamente
Artículo escrito por piyush25pv y traducido por Barcelona Geeks. The original can be accessed here. Licence: CCBY-SA