En este artículo, veremos cómo cambiar el tamaño de las figuras en Matplotlib en Python.
¿Cómo usarlo para plotear?
El objetivo principal de Matplotlib es crear una figura que represente datos. El uso de la visualización de datos es contar historias seleccionando datos en una forma más fácil de entender, destacando las tendencias y los valores atípicos. Podemos poblar la figura con todos los diferentes tipos de datos, incluidos ejes, un gráfico, una forma geométrica, etc. «Cuando» trazamos gráficos, es posible que deseemos establecer el tamaño de una figura en un tamaño determinado. Es posible que desee hacer que la figura sea más ancha en tamaño, más alta en altura, etc.
Aumentar o disminuir el tamaño de la trama en Matplotlib
Esto se puede lograr mediante un atributo de Matplotlib conocido como figsize . El atributo figsize nos permite especificar el ancho y el alto de una figura en pulgadas por unidad.
Sintaxis de matplotlib.pyplot
Sintaxis:
importar matplotlib.pyplot como plt
figure_name = plt.figure(figsize=(ancho, alto))
El atributo figsize es un parámetro de la función figure(). Es un atributo opcional, por defecto la figura tiene las dimensiones como (6.4, 4.8). Esta es una gráfica estándar donde el atributo no se menciona en la función.
Normalmente cada unidad de pulgada es de 80 x 80 píxeles. El número de píxeles por unidad de pulgada se puede cambiar mediante el parámetro dpi, que también se puede especificar en la misma función.
Acercarse:
- Creamos una variable plt_1 y la establecemos igual a plt.figure(figsize=(6,3)).
- Esto crea un objeto de figura, que tiene un ancho de 6 pulgadas y 3 pulgadas de alto.
- Los valores del atributo figsize son una tupla de 2 valores.
Ejemplo 1 : establecer el argumento del tamaño de la figura
Python3
# We start by importing matplotlib
import matplotlib.pyplot as plt

# Plotting a figure of width 6 and height 3
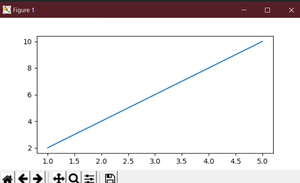
plt_1 = plt.figure(figsize=(6, 3))

# Let's plot the equation y=2*x
x = [1, 2, 3, 4, 5]

# y = [2,4,6,8,10]
y = [x*2 for x in x]

# plt.plot() specifies the arguments for x-axis
# and y-axis to be plotted
plt.plot(x, y)

# To show this figure object, we use the line,
# fig.show()
plt.show()
Producción:

Esto funciona si está utilizando un IDE de Python que no sea un portátil de Júpiter. Si está utilizando cuadernos de Júpiter, entonces no usaría plt.show(). En su lugar, especificaría en el Código justo después de importar matplotlib, %matplotlib en línea.
Ejemplo 2: cambiar el tamaño de la figura en Matplotlib
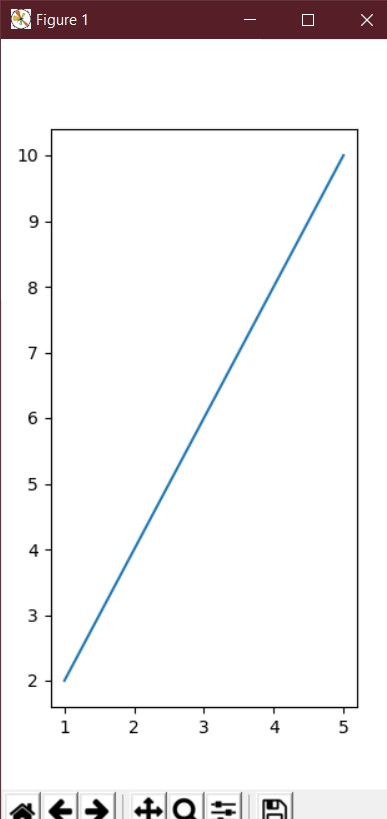
Para ver la naturaleza dinámica del tamaño de las figuras en Matplotlib, ahora tenemos que crear una figura con las dimensiones invertidas. La altura ahora será el doble del tamaño del ancho.
Python3
# We start by importing matplotlib
import matplotlib.pyplot as plt

# Plotting a figure of width 3 and height 6
plt_1 = plt.figure(figsize=(3, 6))

# Let's plot the equation y=2*x
x = [1, 2, 3, 4, 5]

# y = [2,4,6,8,10]
y = [x*2 for x in x]

# plt.plot() specifies the arguments for
# x-axis and y-axis to be plotted
plt.plot(x, y)

# To show this figure object, we use the line,
# fig.show()
plt.show()
Producción:

Ejemplo 3: establecer la altura y el ancho de una figura en Matplotlib
En este ejemplo, veremos que en lugar de simplemente usar figsize, también podemos establecer la altura y el ancho de la trama usando las funciones set_figheight() y set_figwidth() .
Python3
# We start by importing matplotlib
import matplotlib.pyplot as plt

# Plotting a figure of width 10 and height 5
fig = plt.figure()

fig.set_figheight(5)
fig.set_figwidth(10)

# Let's plot the equation y=2*x
x = [1, 2, 3, 4, 5]

# y = [2,4,6,8,10]
y = [x*2 for x in x]

# plt.plot() specifies the arguments for x-axis
# and y-axis to be plotted
plt.plot(x, y)

# To show this figure object, we use the line,
# fig.show()
plt.show()
Producción:

Ejemplo 4: establezca la altura y el ancho de una figura en pulgadas.
Aquí, veremos otro ejemplo de configuración del tamaño de la figura en pulgadas usando set_size_inches(5, 5).
Python3
# We start by importing matplotlib
import matplotlib.pyplot as plt

# Plotting a figure of width 5 and height 5
fig = plt.figure()

fig.set_size_inches(5, 5)

# Let's plot the equation y=2*x
x = [1, 2, 3, 4, 5]

# y = [2,4,6,8,10]
y = [x*2 for x in x]

# plt.plot() specifies the arguments for x-axis
# and y-axis to be plotted
plt.plot(x, y)

# To show this figure object, we use the line,
# fig.show()
plt.show()
Producción:

Publicación traducida automáticamente
Artículo escrito por kshitijjainm y traducido por Barcelona Geeks. The original can be accessed here. Licence: CCBY-SA