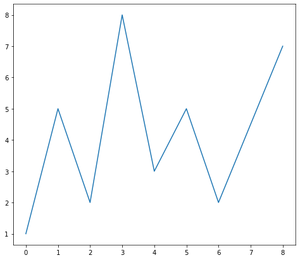
Un marco en la figura de Matplotlib es un objeto dentro del cual los datos dados se representan usando ejes independientes. Estos ejes representan la izquierda, la parte inferior, la derecha y la parte superior, que se pueden visualizar mediante espinas (líneas) y marcas.
Para quitar el marco (recuadro alrededor de la figura) en Matplotlib seguimos los pasos. Aquí, en primer lugar, trazaremos una figura 2D en Matplotlib importando la biblioteca Matplotlib.
Sintaxis: plt.tick_params(axis=’x’, which=’both’, bottom=False, top=False, labelbottom=False)
Acercarse:
- Seleccione el eje a aplicar. Y seleccione el tick por el cual se aplican los parámetros, generalmente puede ser ‘mayor’, ‘menor’ o ‘ambos’.
- Obtenga el Axex actual y seleccione la visibilidad de las espinas como Falso.
Python3
# Importing the Library

import matplotlib.pyplot as plt
# Defining X-axis and Y-axis data Points
x = [0, 1, 2, 3, 4, 5, 6, 8]
y = [1, 5, 2, 8, 3, 5, 2, 7]

# Defining the Width and height of the Figure
plt.figure(figsize=(8, 7))
plt.plot(x, y)
plt.show()
Producción:

La salida dada contiene el marco con las espinas y las marcas. Al eliminar el marco, en realidad estamos eliminando el cuadro alrededor de la figura que contiene los ejes (izquierda, abajo, derecha, arriba).
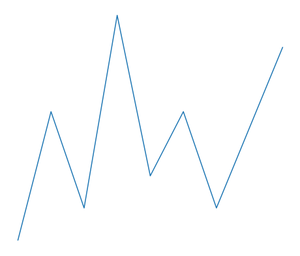
Para eliminar las espinas indicadas por Black Lines podemos seguir los pasos,
Python3
plt.figure(figsize=(4, 3))

plt.plot(x, y)

# Selecting the axis-X making the bottom and top axes False.
plt.tick_params(axis='x', which='both', bottom=False,
                top=False, labelbottom=False)

# Selecting the axis-Y making the right and left axes False
plt.tick_params(axis='y', which='both', right=False,
                left=False, labelleft=False)

# Iterating over all the axes in the figure
# and make the Spines Visibility as False
for pos in ['right', 'top', 'bottom', 'left']:
    plt.gca().spines[pos].set_visible(False)
plt.show()
Producción:

Publicación traducida automáticamente
Artículo escrito por codewithdev y traducido por Barcelona Geeks. The original can be accessed here. Licence: CCBY-SA