En este artículo, corregiremos el error: TypeError: no hay datos numéricos para trazar
Casos de ocurrencia de este error:
Python3
# importing pandas
import pandas as pd
# importing numpy
import numpy as np
import matplotlib.pyplot as plt

petal_length = ['3.3', '3.5', '4.0', '4.5',
                '4.6', '5.0', '5.5', '6.0',
                '6.5', '7.0']
petal_width = ['3.6', '3.8', '4.4', '6.6',
               '6.8', '7.0', '7.5', '8.0',
               '8.5', '8.9']


df = pd.DataFrame({'petal_length(cm)': petal_length,
                   'petal_width(cm)': petal_width})
df.plot(x='petal_length(cm)', y='petal_width(cm)')
plt.show()
Producción:
TypeError: no numeric data to plot
Motivo del error:
El trazado solo se puede realizar en datos numéricos cuando trazamos los datos con un tipo de datos diferente al de los datos numéricos que genera este error. Para saber si los tipos de datos son numéricos o no podemos saberlo usando la función dtypes() .
print(df.dtypes)
Los datos que usamos para graficar deben ser numéricos.
Arreglando el error:
Este error se puede solucionar convirtiendo los datos que se trazarán en datos numéricos. Para convertir los datos a datos numéricos podemos usar las funciones astype() o to_numeric().
Método 1: Usar la función astype()
Sintaxis:
df['column_name']= df['column_name'].astype(data_type)
donde, df es el marco de datos de entrada
Ejemplo:
Python3
# importing pandas
import pandas as pd
# importing numpy
import numpy as np
# importing matplotlib.pyplot
import matplotlib.pyplot as plt

petal_length = ['3.3', '3.5', '4.0', '4.5',
                '4.6', '5.0', '5.5', '6.0',
                '6.5', '7.0']
petal_width = ['3.6', '3.8', '4.4', '6.6',
               '6.8', '7.0', '7.5', '8.0',
               '8.5', '8.9']


df = pd.DataFrame({'petal_length(cm)': petal_length,
                   'petal_width(cm)': petal_width})
df['petal_length(cm)'] = df['petal_length(cm)'].astype(float)
df['petal_width(cm)'] = df['petal_width(cm)'].astype(float)

df.plot(x='petal_length(cm)', y='petal_width(cm)')
plt.show()
Salida :
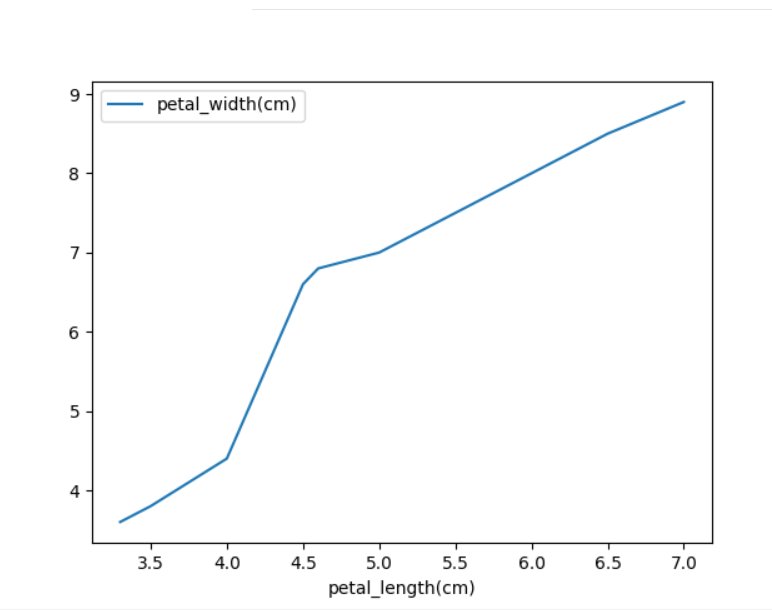
Método 2: Usar la función to_numeric()
Sintaxis:
df['column_name'] = pd.to_numeric(df['column_name'])
donde df es el marco de datos de entrada
Ejemplo :
Python3
# importing pandas
import pandas as pd
# importing numpy
import numpy as np
# importing matplotlib.pyplot
import matplotlib.pyplot as plt

petal_length = ['3.3', '3.5', '4.0', '4.5',
                '4.6', '5.0', '5.5', '6.0',
                '6.5', '7.0']
petal_width = ['3.6', '3.8', '4.4', '6.6',
               '6.8', '7.0', '7.5', '8.0',
               '8.5', '8.9']


df = pd.DataFrame({'petal_length(cm)': petal_length,
                   'petal_width(cm)': petal_width})
# Using to_numeric() function
df['petal_length(cm)'] = pd.to_numeric(df['petal_length(cm)'])
df['petal_width(cm)'] = pd.to_numeric(df['petal_width(cm)'])

df.plot(x='petal_length(cm)', y='petal_width(cm)')
plt.show()
Producción:
Publicación traducida automáticamente
Artículo escrito por lokeshpotta20 y traducido por Barcelona Geeks. The original can be accessed here. Licence: CCBY-SA