En este artículo veremos cómo podemos filtrar las etiquetas de la imagen etiquetada en mahotas. La etiqueta de filtrado es similar a implementar la función de reetiquetado, pero la diferencia está en el filtrado que eliminaremos, es decir, filtraremos las etiquetas en el momento de llamar al método de filtrado y el filtrado nos dará una nueva imagen etiquetada y una cantidad de etiquetas. Usamos el método mahotas.label para etiquetar la imagen
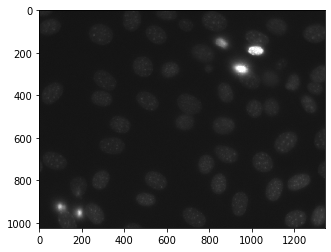
. Para esto, vamos a usar la imagen de microscopía fluorescente de un punto de referencia de segmentación nuclear. Podemos obtener la imagen con la ayuda del comando que se indica a continuación.
mhotas.demos.nuclear_image()
A continuación se muestra la imagen_nuclear

Las imágenes etiquetadas son imágenes enteras donde los valores corresponden a diferentes regiones. Es decir, la región 1 son todos los píxeles que tienen valor 1, la región dos son los píxeles con valor 2, y así sucesivamente.
Para hacer esto, usaremos el método mahotas.label.filter_labelled
Sintaxis: mahotas.label.filter_labelled(label_image, filter1, filter2)
Argumento: toma el objeto de imagen etiquetado y los filtros como argumento
Retorno: devuelve la imagen etiquetada y el número entero, es decir, el número de etiquetas
Nota: los filtros pueden ser filtros de etiqueta de borde, cualquier tamaño máximo.
Ejemplo 1:
Python3
# importing required libraries
import mahotas
import numpy as np
from pylab import imshow, show
import os

# loading nuclear image
f = mahotas.demos.load('nuclear')

# setting filter to the image
f = f[:, :, 0]

# setting gaussian filter
f = mahotas.gaussian_filter(f, 4)

# setting threshold value
f = (f> f.mean())

# creating a labelled image
labelled, n_nucleus = mahotas.label(f)

# printing number of labels
print("Count : " + str(n_nucleus))

# showing the labelled image
print("Labelled Image")
imshow(labelled)
show()


# filtering the label image
# adding border filter
relabelled, n_left = mahotas.labelled.filter_labelled(labelled, remove_bordering = True)

# showing number of labels
print("Count : " + str(n_left))

# showing the image
print("No border Label")
imshow(relabelled)
show()
Producción :

Ejemplo 2:
Python3
# importing required libraries
import mahotas
import numpy as np
from pylab import imshow, show
import os

# loading nuclear image
f = mahotas.demos.load('nuclear')

# setting filter to the image
f = f[:, :, 0]

# setting gaussian filter
f = mahotas.gaussian_filter(f, 4)

# setting threshold value
f = (f> f.mean())

# creating a labelled image
labelled, n_nucleus = mahotas.label(f)

# printing number of labels
print("Count : " + str(n_nucleus))

# showing the labelled image
print("Labelled Image")
imshow(labelled)
show()


# filtering the label image
# adding max size filter
relabelled, n_left = mahotas.labelled.filter_labelled(labelled, max_size = 7000)

# showing number of labels
print("Count : " + str(n_left))

# showing the image
print("Max size 7000 Label")
imshow(relabelled)
show()
Producción :

Publicación traducida automáticamente
Artículo escrito por rakshitarora y traducido por Barcelona Geeks. The original can be accessed here. Licence: CCBY-SA