Clase de artista de Matplotlib en un FigureCanvas. Todos los elementos visibles en una figura son subclases de Artista.
Método Matplotlib.artist.Artist.findobj()
El método findobj () en el módulo de artista de la biblioteca matplotlib
Sintaxis: Artista.
Parámetros: este método acepta los siguientes parámetros.
- match : Este parámetro es el criterio de filtrado de las coincidencias. Su valor predeterminado es Ninguno.
- include_self : este parámetro se incluye a sí mismo en la lista para verificar si hay una coincidencia.
Devoluciones: este método devuelve artistas (lista de artistas).
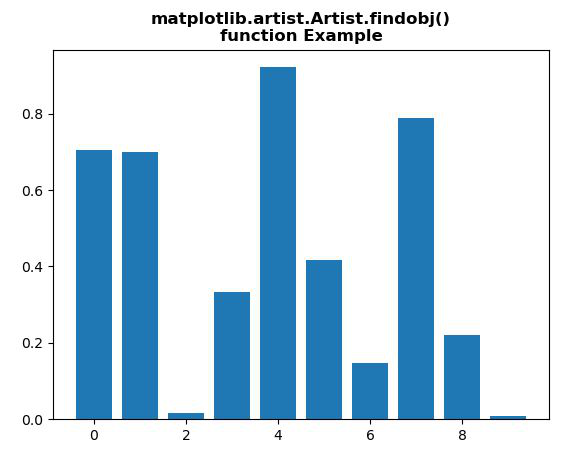
Los siguientes ejemplos ilustran la función matplotlib.artist.Artist.() en matplotlib:
Ejemplo 1:
# Implementation of matplotlib function
from matplotlib.artist import Artist
import matplotlib.pyplot as plt
from matplotlib.lines import Line2D
import numpy as np
from numpy.random import rand


fig, ax2 = plt.subplots()

ax2.bar(range(10), rand(10), picker = True)

print("Value return : \n",
      *list(Artist.findobj(ax2)), sep ="\n")

plt.title("""matplotlib.artist.Artist.findobj()
function Example""", fontweight="bold")

plt.show()
Producción:
Value return :

Rectangle(xy=(-0.4, 0), width=0.8, height=0.705031, angle=0)
Rectangle(xy=(0.6, 0), width=0.8, height=0.698788, angle=0)
Rectangle(xy=(1.6, 0), width=0.8, height=0.0159568, angle=0)
Rectangle(xy=(2.6, 0), width=0.8, height=0.332931, angle=0)
Rectangle(xy=(3.6, 0), width=0.8, height=0.921611, angle=0)
Rectangle(xy=(4.6, 0), width=0.8, height=0.4171, angle=0)
Rectangle(xy=(5.6, 0), width=0.8, height=0.148145, angle=0)
Rectangle(xy=(6.6, 0), width=0.8, height=0.78801, angle=0)
Rectangle(xy=(7.6, 0), width=0.8, height=0.221423, angle=0)
Rectangle(xy=(8.6, 0), width=0.8, height=0.00829394, angle=0)
Spine
Spine
Spine
Spine
Text(0.5, 0, '')
Text(1, 0, '')
Line2D()
Line2D()
Line2D((0,0),(0,1))
Text(0, 0, '')
Text(0, 1, '')
<matplotlib.axis.XTick object at 0x07BE51D0>
Line2D()
Line2D()
Line2D((0,0),(0,1))
Text(0, 0, '')
Text(0, 1, '')
<matplotlib.axis.XTick object at 0x07BE51B0>
Line2D()
Line2D()
Line2D((0,0),(0,1))
Text(0, 0, '')
Text(0, 1, '')
<matplotlib.axis.XTick object at 0x0A589750>
Line2D()
Line2D()
Line2D((0,0),(0,1))
Text(0, 0, '')
Text(0, 1, '')
<matplotlib.axis.XTick object at 0x0A5A1C50>
Line2D()
Line2D()
Line2D((0,0),(0,1))
Text(0, 0, '')
Text(0, 1, '')
<matplotlib.axis.XTick object at 0x0A5A1B70>
Line2D()
Line2D()
Line2D((0,0),(0,1))
Text(0, 0, '')
Text(0, 1, '')
<matplotlib.axis.XTick object at 0x0A5B4170>
Line2D()
Line2D()
Line2D((0,0),(0,1))
Text(0, 0, '')
Text(0, 1, '')
<matplotlib.axis.XTick object at 0x0A5B4430>
XAxis(80.0,52.8)
Text(0, 0.5, '')
Text(0, 0.5, '')
Line2D()
Line2D()
Line2D((0,0),(1,0))
Text(0, 0, '')
Text(1, 0, '')
<matplotlib.axis.YTick object at 0x07BE58F0>
Line2D()
Line2D()
Line2D((0,0),(1,0))
Text(0, 0, '')
Text(1, 0, '')
<matplotlib.axis.YTick object at 0x07BE5570>
Line2D()
Line2D()
Line2D((0,0),(1,0))
Text(0, 0, '')
Text(1, 0, '')
<matplotlib.axis.YTick object at 0x0A5B4670>
Line2D()
Line2D()
Line2D((0,0),(1,0))
Text(0, 0, '')
Text(1, 0, '')
<matplotlib.axis.YTick object at 0x0A5B4AB0>
Line2D()
Line2D()
Line2D((0,0),(1,0))
Text(0, 0, '')
Text(1, 0, '')
<matplotlib.axis.YTick object at 0x0A5B4D90>
Line2D()
Line2D()
Line2D((0,0),(1,0))
Text(0, 0, '')
Text(1, 0, '')
<matplotlib.axis.YTick object at 0x0A5BE0F0>
YAxis(80.0,52.8)
Text(0.5, 1.0, '')
Text(0.0, 1.0, '')
Text(1.0, 1.0, '')
Rectangle(xy=(0, 0), width=1, height=1, angle=0)
AxesSubplot(0.125,0.11;0.775x0.77)
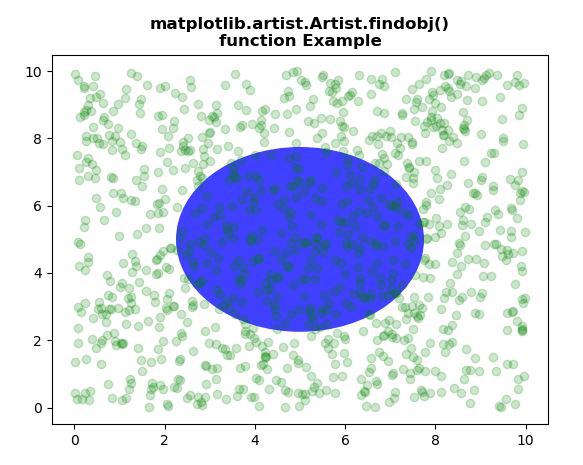
Ejemplo 2:
# Implementation of matplotlib function
from matplotlib.artist import Artist
import numpy as np
import matplotlib.pyplot as plt
import matplotlib.patches as mpatches


fig, ax = plt.subplots()
x, y = 10 * np.random.rand(2, 1000)
ax.plot(x, y, 'go', alpha = 0.2)

circ = mpatches.Circle((0.5, 0.5), 0.25,
                       transform = ax.transAxes,
                       facecolor ='blue',
                       alpha = 0.75)
ax.add_patch(circ)

print("Value return : \n",
      *list(Artist.findobj(ax)), sep ="\n")

plt.title("""matplotlib.artist.Artist.findobj()
function Example""", fontweight="bold")

plt.show()
Producción:
Value return :

Circle(xy=(0.5, 0.5), radius=0.25)
Line2D(_line0)
Spine
Spine
Spine
Spine
Text(0.5, 0, '')
Text(1, 0, '')
Line2D()
Line2D()
Line2D((0,0),(0,1))
Text(0, 0, '')
Text(0, 1, '')
<matplotlib.axis.XTick object at 0x085071F0>
Line2D()
Line2D()
Line2D((0,0),(0,1))
Text(0, 0, '')
Text(0, 1, '')
<matplotlib.axis.XTick object at 0x085071D0>
Line2D()
Line2D()
Line2D((0,0),(0,1))
Text(0, 0, '')
Text(0, 1, '')
<matplotlib.axis.XTick object at 0x0AE7ABF0>
Line2D()
Line2D()
Line2D((0,0),(0,1))
Text(0, 0, '')
Text(0, 1, '')
<matplotlib.axis.XTick object at 0x0AE7AD70>
Line2D()
Line2D()
Line2D((0,0),(0,1))
Text(0, 0, '')
Text(0, 1, '')
<matplotlib.axis.XTick object at 0x0AE920F0>
Line2D()
Line2D()
Line2D((0,0),(0,1))
Text(0, 0, '')
Text(0, 1, '')
<matplotlib.axis.XTick object at 0x0AE92390>
Line2D()
Line2D()
Line2D((0,0),(0,1))
Text(0, 0, '')
Text(0, 1, '')
<matplotlib.axis.XTick object at 0x0AE92650>
Line2D()
Line2D()
Line2D((0,0),(0,1))
Text(0, 0, '')
Text(0, 1, '')
<matplotlib.axis.XTick object at 0x0AE928F0>
XAxis(80.0,52.8)
Text(0, 0.5, '')
Text(0, 0.5, '')
Line2D()
Line2D()
Line2D((0,0),(1,0))
Text(0, 0, '')
Text(1, 0, '')
<matplotlib.axis.YTick object at 0x08507910>
Line2D()
Line2D()
Line2D((0,0),(1,0))
Text(0, 0, '')
Text(1, 0, '')
<matplotlib.axis.YTick object at 0x08507590>
Line2D()
Line2D()
Line2D((0,0),(1,0))
Text(0, 0, '')
Text(1, 0, '')
<matplotlib.axis.YTick object at 0x0AE92A90>
Line2D()
Line2D()
Line2D((0,0),(1,0))
Text(0, 0, '')
Text(1, 0, '')
<matplotlib.axis.YTick object at 0x0AE92DB0>
Line2D()
Line2D()
Line2D((0,0),(1,0))
Text(0, 0, '')
Text(1, 0, '')
<matplotlib.axis.YTick object at 0x0AE92FF0>
Line2D()
Line2D()
Line2D((0,0),(1,0))
Text(0, 0, '')
Text(1, 0, '')
<matplotlib.axis.YTick object at 0x0AE92B10>
Line2D()
Line2D()
Line2D((0,0),(1,0))
Text(0, 0, '')
Text(1, 0, '')
<matplotlib.axis.YTick object at 0x0AE7AC50>
Line2D()
Line2D()
Line2D((0,0),(1,0))
Text(0, 0, '')
Text(1, 0, '')
<matplotlib.axis.YTick object at 0x0AEA00F0>
YAxis(80.0,52.8)
Text(0.5, 1.0, '')
Text(0.0, 1.0, '')
Text(1.0, 1.0, '')
Rectangle(xy=(0, 0), width=1, height=1, angle=0)
AxesSubplot(0.125,0.11;0.775x0.77)
Publicación traducida automáticamente
Artículo escrito por shivanisinghss2110 y traducido por Barcelona Geeks. The original can be accessed here. Licence: CCBY-SA

