Matplotlib es una biblioteca en Python y es una extensión matemática numérica para la biblioteca NumPy. La clase Axes contiene la mayoría de los elementos de la figura: Axis, Tick, Line2D, Text, Polygon, etc., y establece el sistema de coordenadas. Y las instancias de Axes admiten devoluciones de llamada a través de un atributo de devoluciones de llamada.
Función matplotlib.axes.Axes.get_lines()
La función Axes.get_lines() en el módulo de ejes de la biblioteca matplotlib se usa para devolver una lista de líneas contenidas en los ejes
Sintaxis: Axes.get_lines(self)
Parámetros: este método no acepta ningún parámetro.
Devoluciones: este método devuelve una lista de líneas contenidas en los ejes.
Los siguientes ejemplos ilustran la función matplotlib.axes.Axes.get_lines() en matplotlib.axes:
Ejemplo 1:
# Implementation of matplotlib function
from matplotlib import colors
from matplotlib.ticker import PercentFormatter
import numpy as np
import matplotlib.pyplot as plt


N_points = 100000
x = np.random.randn(N_points)
y = .4 * x + np.random.randn(100000) + 5

fig, ax = plt.subplots()
ax.hist2d(x, y, bins = 100,
          norm = colors.LogNorm(),
          cmap ="Greens")

w = list(ax.get_lines())
if len(w)== 0:
    ax.text(-2, 8.5,
            "No line contained by the Axes \n")
else:
    ax.text(-3, 8.5,
            "List of the lines contained by the Axes \n")
    x = 8.5
    for i in w:

        ax.text(-3, x-0.5, str(i))
        x-= 0.5

fig.suptitle('matplotlib.axes.Axes.get_lines() \
function Example', fontweight ="bold")

plt.show()
Producción: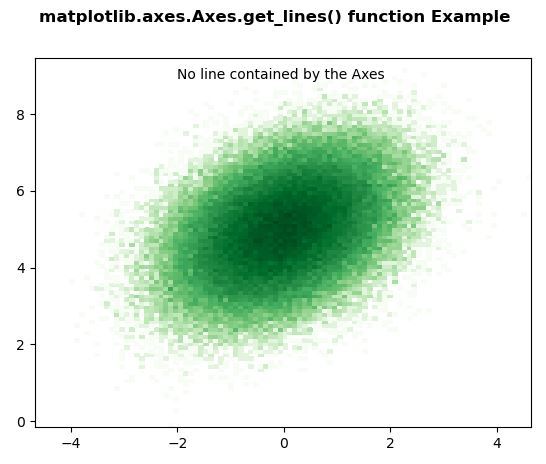
Ejemplo 2:
# Implementation of matplotlib function
import numpy as np
import matplotlib.pyplot as plt
import matplotlib.patches as mpatches


fig, ax = plt.subplots()
x, y = 10 * np.random.rand(2, 1000)
ax.plot(x, y, 'go', alpha = 0.2)

circ = mpatches.Circle((0.5, 0.5),
                       0.25,
                       transform = ax.transAxes,
                       facecolor ='blue',
                       alpha = 0.75)

ax.add_patch(circ)

w = list(ax.get_lines())

if len(w)== 0:
    ax.text(1, 8.5,
            "No line contained by the Axes \n")

else:
    ax.text(1, 8.5,
            "List of the lines contained by the Axes \n")
    x = 8.5

    for i in w:
        ax.text(1, x-0.5, str(i))
        x-= 0.5

fig.suptitle('matplotlib.axes.Axes.get_lines() \
function Example', fontweight ="bold")

plt.show()
Producción: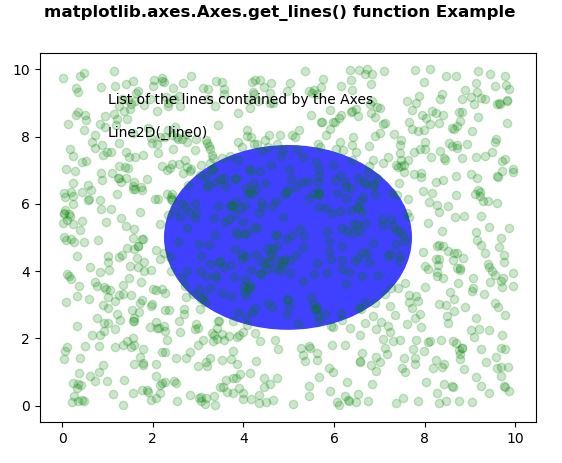
Publicación traducida automáticamente
Artículo escrito por SHUBHAMSINGH10 y traducido por Barcelona Geeks. The original can be accessed here. Licence: CCBY-SA