Matplotlib es una biblioteca en Python y es una extensión matemática numérica para la biblioteca NumPy. La clase Axes contiene la mayoría de los elementos de la figura: Axis, Tick, Line2D, Text, Polygon, etc., y establece el sistema de coordenadas. Y las instancias de Axes admiten devoluciones de llamada a través de un atributo de devoluciones de llamada.
función matplotlib.axes.Axes.get_transformed_clip_path_and_affine()
La función Axes.get_transformed_clip_path_and_affine() en el módulo de ejes de la biblioteca matplotlib se usa para obtener la ruta del clip con la parte no afín de su transformación aplicada y la parte afín restante de su transformación.
Sintaxis: Axes.get_transformed_clip_path_and_affine(self)
Parámetros: Este método no acepta ningún parámetro.
Devoluciones: este método devuelve la ruta del clip con la parte no afín de su transformación aplicada y la parte afín restante de su transformación.
Los siguientes ejemplos ilustran la función matplotlib.axes.Axes.get_transformed_clip_path_and_affine() en matplotlib.axes:
Ejemplo 1:
Imagen utilizada:

# Implementation of matplotlib function
import matplotlib.pyplot as plt
import matplotlib.patches as patches
import matplotlib.cbook as cbook


with cbook.get_sample_data('loggf.PNG') as image_file:
    image = plt.imread(image_file)

fig, ax = plt.subplots()
im = ax.imshow(image)
patch = patches.Rectangle((0, 0), 260, 200,
                          transform = ax.transData)

ax.set_title("Value Return by get_transformed_clip_path_and_affine(): "
             +str(im.get_transformed_clip_path_and_affine()))

fig.suptitle('matplotlib.axes.Axes.get_transformed_clip_path_and_affine()\
 function Example\n\n', fontweight ="bold")

plt.show()
Producción: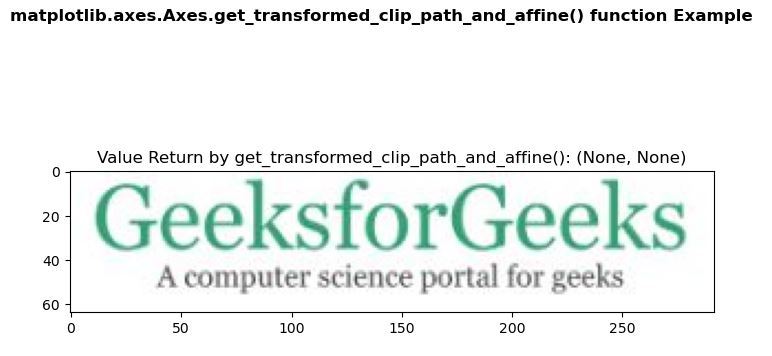
Ejemplo 2:
# Implementation of matplotlib function
import numpy as np
import matplotlib.cm as cm
import matplotlib.pyplot as plt
from matplotlib.path import Path
from matplotlib.patches import PathPatch


delta = 0.025

x = y = np.arange(-3.0, 3.0, delta)
X, Y = np.meshgrid(x, y)

Z1 = np.exp(-X**2 - Y**2)
Z2 = np.exp(-(X - 1)**2 - (Y - 1)**2)
Z = (Z1 - Z2) * 2

path = Path([[0, 1], [1, 0], [0, -1], [-1, 0], [0, 1]])
patch = PathPatch(path, facecolor ='none')

fig, ax = plt.subplots()
ax.add_patch(patch)
im = ax.imshow(Z,
               interpolation ='bilinear',
               cmap = cm.gray,
               origin ='lower',
               extent =[-3, 3, -3, 3],
               clip_path = patch,
               clip_on = True)

print("Value Return by get_transformed_clip_path_and_affine(): ")

for i in im.get_transformed_clip_path_and_affine():
    print(i)

fig.suptitle('matplotlib.axes.Axes.get_transformed_clip_path_and_affine()\
 function Example\n\n', fontweight ="bold")

plt.show()
Producción:
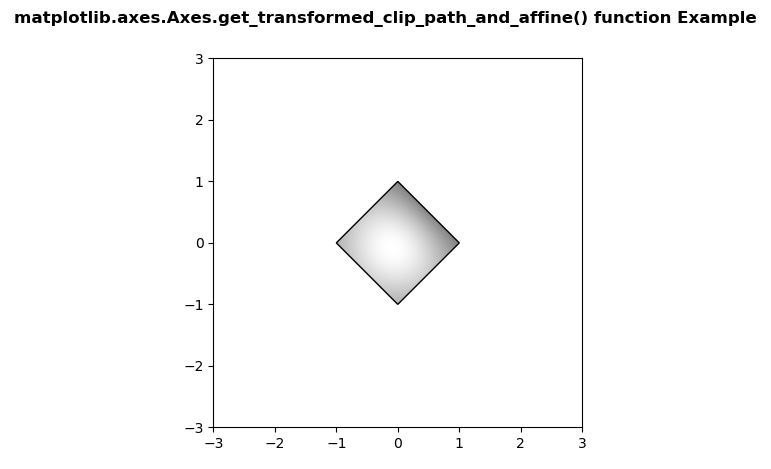
Value Return by get_transformed_clip_path_and_affine():
Path(array([[ 0.,  1.],
       [ 1.,  0.],
       [ 0., -1.],
       [-1.,  0.],
       [ 0.,  1.]]), None)
Affine2D(
    [[ 82.66666667   0.         328.        ]
     [  0.          61.6        237.6       ]
     [  0.           0.           1.        ]])
Publicación traducida automáticamente
Artículo escrito por SHUBHAMSINGH10 y traducido por Barcelona Geeks. The original can be accessed here. Licence: CCBY-SA