Matplotlib es una biblioteca en Python y es una extensión matemática numérica para la biblioteca NumPy. La clase Axes contiene la mayoría de los elementos de la figura: Axis, Tick, Line2D, Text, Polygon, etc., y establece el sistema de coordenadas. Y las instancias de Axes admiten devoluciones de llamada a través de un atributo de devoluciones de llamada.
función matplotlib.axes.Axes.set_xticks()
La función Axes.set_xticks() en el módulo de ejes de la biblioteca matplotlib se usa para establecer los x ticks con la lista de ticks.
Sintaxis: Axes.set_xticks(self, ticks, minor=False)
Parámetros: este método acepta los siguientes parámetros.
- ticks : este parámetro es la lista de ubicaciones de ticks en el eje x.
- minor : Este parámetro se utiliza tanto para establecer ticks mayores como para establecer ticks menores.
Valor devuelto: Este método no devuelve ningún valor.
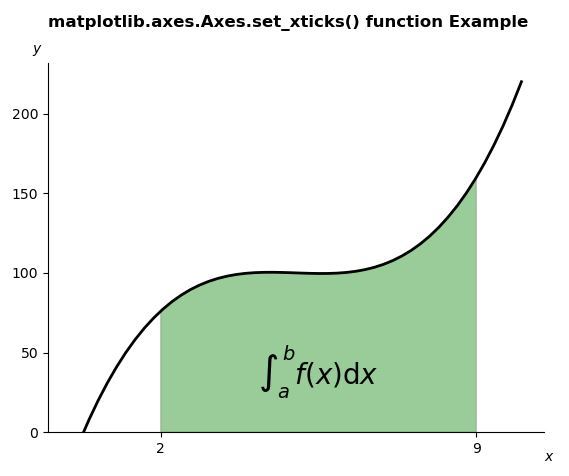
Los siguientes ejemplos ilustran la función matplotlib.axes.Axes.set_xticks() en matplotlib.axes:
Ejemplo 1:
# Implementation of matplotlib function
import numpy as np
import matplotlib.pyplot as plt
from matplotlib.patches import Polygon


def func(x):
    return (x - 4) * (x - 6) * (x - 5) + 100


a, b = 2, 9  # integral limits
x = np.linspace(0, 10)
y = func(x)

fig, ax = plt.subplots()
ax.plot(x, y, "k", linewidth = 2)
ax.set_ylim(bottom = 0)

# Make the shaded region
ix = np.linspace(a, b)
iy = func(ix)
verts = [(a, 0), *zip(ix, iy), (b, 0)]
poly = Polygon(verts, facecolor ='green',
               edgecolor ='0.5', alpha = 0.4)
ax.add_patch(poly)

ax.text(0.5 * (a + b), 30,
        r"$\int_a ^ b f(x)\mathrm{d}x$",
        horizontalalignment ='center',
        fontsize = 20)

fig.text(0.9, 0.05, '$x$')
fig.text(0.1, 0.9, '$y$')

ax.spines['right'].set_visible(False)
ax.spines['top'].set_visible(False)
ax.set_xticks((a, b))

fig.suptitle('matplotlib.axes.Axes.set_xticks()\
 function Example\n\n', fontweight ="bold")
fig.canvas.draw()
plt.show()
Producción:
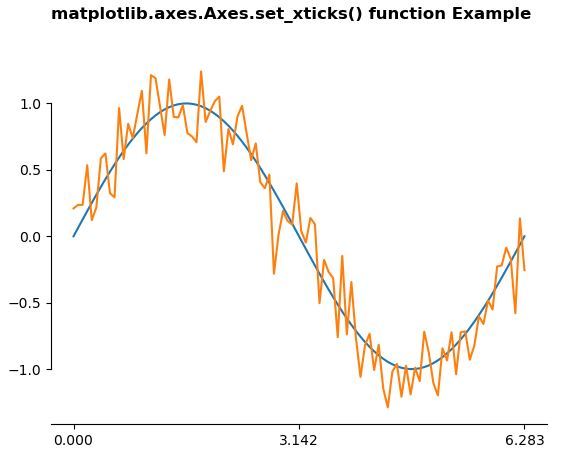
Ejemplo 2:
# Implementation of matplotlib function
import numpy as np
import matplotlib.pyplot as plt

# Fixing random state for reproducibility
np.random.seed(19680801)

x = np.linspace(0, 2 * np.pi, 100)
y = np.sin(x)
y2 = y + 0.2 * np.random.normal(size = x.shape)

fig, ax = plt.subplots()
ax.plot(x, y)
ax.plot(x, y2)

ax.set_xticks([0, np.pi, 2 * np.pi])

ax.spines['left'].set_bounds(-1, 1)
ax.spines['right'].set_visible(False)
ax.spines['top'].set_visible(False)

fig.suptitle('matplotlib.axes.Axes.set_xticks() \
function Example\n\n', fontweight ="bold")
fig.canvas.draw()
plt.show()
Producción:
Publicación traducida automáticamente
Artículo escrito por SHUBHAMSINGH10 y traducido por Barcelona Geeks. The original can be accessed here. Licence: CCBY-SA