Matplotlib es una biblioteca en Python y es una extensión matemática numérica para la biblioteca NumPy. La clase Axes contiene la mayoría de los elementos de la figura: Axis, Tick, Line2D, Text, Polygon, etc., y establece el sistema de coordenadas. Y las instancias de Axes admiten devoluciones de llamada a través de un atributo de devoluciones de llamada.
función matplotlib.axes.Axes.tick_params()
La función Axes.tick_params() en el módulo de ejes de la biblioteca matplotlib se usa para controlar el comportamiento de los principales localizadores de ticks.
Sintaxis: Axes.tick_params(self, axis=’ambos’, **kwargs)
Parámetros: este método acepta los siguientes parámetros.
- eje : Este parámetro es el utilizado a qué eje aplicar los parámetros.
Valor devuelto: Este método no devuelve ningún valor.
Los siguientes ejemplos ilustran la función matplotlib.axes.Axes.tick_params() en matplotlib.axes:
Ejemplo 1:
# Implementation of matplotlib function
import matplotlib.pyplot as plt
import numpy as np

values = np.array([
    0.015, 0.166, 0.133, 0.159, 0.041,
    0.024, 0.195, 0.039, 0.161, 0.018,
    0.143, 0.056, 0.125, 0.096, 0.094,
    0.051, 0.043, 0.021, 0.138, 0.075,
    0.109, 0.195, 0.050, 0.074, 0.079,
    0.155, 0.020, 0.010, 0.061, 0.008])

values[[3, 14]] += .8

fig, (ax, ax2) = plt.subplots(2, 1, sharex = True)

ax.plot(values, "o-", color ="green")
ax2.plot(values, "o-", color ="green")

ax.set_ylim(.78, 1.)
ax2.set_ylim(0, .22)

ax.spines['bottom'].set_visible(False)
ax2.spines['top'].set_visible(False)
ax.xaxis.tick_top()
ax.tick_params(labeltop = False)
ax2.xaxis.tick_bottom()

d = .005
kwargs = dict(transform = ax.transAxes,
              color ='k', clip_on = False)

ax.plot((-d, +d), (-d, +d), **kwargs)
ax.plot((1 - d, 1 + d), (-d, +d), **kwargs)

kwargs.update(transform = ax2.transAxes)
ax2.plot((-d, +d), (1 - d, 1 + d), **kwargs)
ax2.plot((1 - d, 1 + d), (1 - d, 1 + d), **kwargs)

fig.suptitle('matplotlib.axes.Axes.tick_params()\
function Example\n\n', fontweight ="bold")

plt.show()
Producción: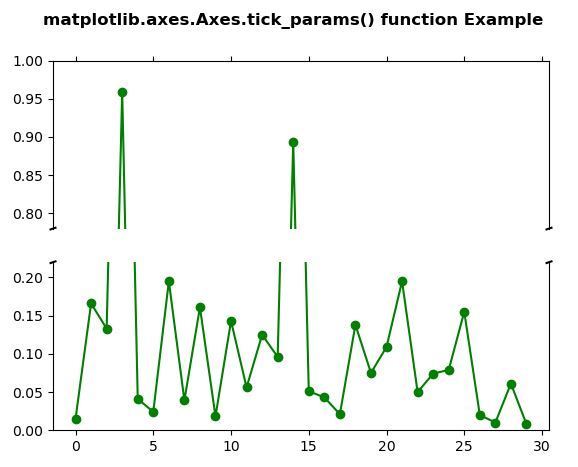
Ejemplo 2:
# Implementation of matplotlib function
import matplotlib.pyplot as plt


def make_patch_spines_invisible(ax):
    ax.set_frame_on(True)
    ax.patch.set_visible(False)
    for sp in ax.spines.values():
        sp.set_visible(False)


fig, host = plt.subplots()
fig.subplots_adjust(right = 0.75)

par1 = host.twinx()
par2 = host.twinx()

# Offset the right spine of par2.
# The ticks and label have already been
# placed on the right by twinx above.
par2.spines["right"].set_position(("axes",
                                   1.2))

# Having been created by twinx, par2
# has its frame off, so the line of its
# detached spine is invisible.  First,
# activate the frame but make the patch
# and spines invisible.
make_patch_spines_invisible(par2)

# Second, show the right spine.
par2.spines["right"].set_visible(True)

p1, = host.plot([0, 1, 2], [0, 1, 2], "b-",
                label ="Y-label 1")

p2, = par1.plot([0, 1, 2], [0, 30, 20],
                "r-", label ="Y-label 2")

p3, = par2.plot([0, 1, 2], [500, 300, 150],
                "g-", label ="Y-label 3")

host.set_xlim(0.25, 1.75)
host.set_ylim(0.25, 1.75)
par1.set_ylim(0, 40)
par2.set_ylim(10, 500)

host.set_xlabel("X-label")
host.set_ylabel("Y-label 1")
par1.set_ylabel("Y-label 2")
par2.set_ylabel("Y-label 3")

host.yaxis.label.set_color(p1.get_color())
par1.yaxis.label.set_color(p2.get_color())
par2.yaxis.label.set_color(p3.get_color())

tkw = dict(size = 4, width = 1.5)
host.tick_params(axis ='y',
                 colors = p1.get_color(),
                 **tkw)

par1.tick_params(axis ='y',
                 colors = p2.get_color(),
                 **tkw)

par2.tick_params(axis ='y',
                 colors = p3.get_color(),
                 **tkw)

host.tick_params(axis ='x', **tkw)

lines = [p1, p2, p3]

host.legend(lines, [l.get_label() for l in lines])


fig.suptitle('matplotlib.axes.Axes.tick_params()\
function Example\n\n', fontweight ="bold")

plt.show()
Producción: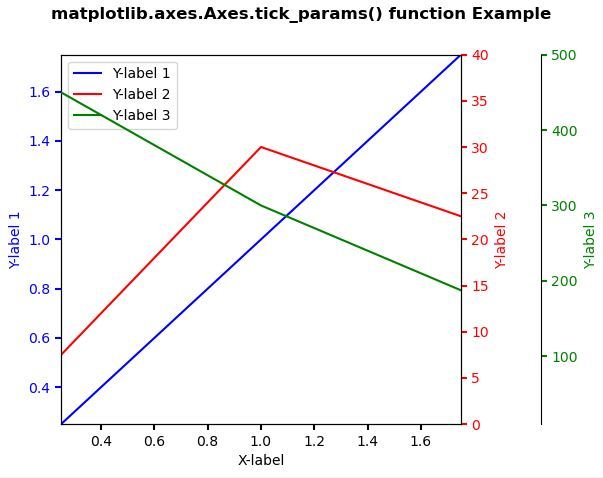
Publicación traducida automáticamente
Artículo escrito por SHUBHAMSINGH10 y traducido por Barcelona Geeks. The original can be accessed here. Licence: CCBY-SA