Matplotlib es una biblioteca de gráficos para crear visualizaciones estáticas, animadas e interactivas en Python. Pyplot es un módulo de Matplotlib que proporciona una interfaz similar a MATLAB. Matplotlib está diseñado para ser tan útil como MATLAB, con la capacidad de usar Python y la ventaja de ser gratuito y de código abierto.
matplotlib.pyplot.axis()
Esta función se utiliza para establecer algunas propiedades del eje en el gráfico.
Sintaxis: matplotlib.pyplot.axis(*args, emit=True, **kwargs)
Parámetros:
xmin, xmax, ymin, ymax : estos parámetros se pueden usar para
establecer los límites del eje en el gráfico
. Emisión: es un valor bool que se usa para notificar a los observadores el cambio del límite del eje
Ejemplo 1:
import matplotlib.pyplot as plt


x =[1, 2, 3, 4, 5]
y =[2, 4, 6, 8, 10]

# Plotting the graph
plt.plot(x, y)

# Setting the x-axis to 1-10
# and y-axis to 1-15
plt.axis([0, 10, 1, 15])

# Showing the graph with updated axis
plt.show()
Producción: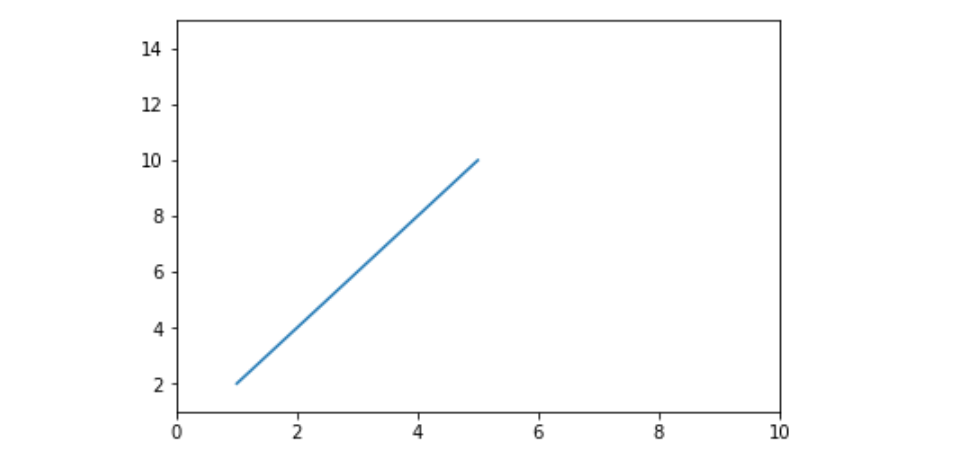
Ejemplo #2:
import matplotlib.pyplot as plt

x =[1, 2, 3, 4, 5]
y =[2, 4, 6, 8, 10]

plt.plot(x, y)

# we can turn off the axis and display
# only the line by passing the
# optional parameter 'off' to it
plt.axis('off')

plt.show()
Producción: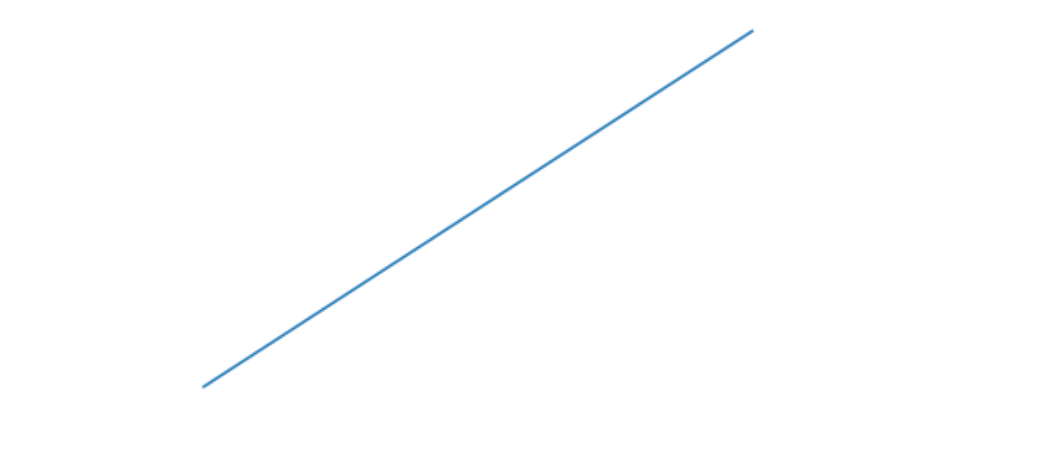
Publicación traducida automáticamente
Artículo escrito por sathvik chiramana y traducido por Barcelona Geeks. The original can be accessed here. Licence: CCBY-SA