Matplotlib es una biblioteca de gráficos para crear visualizaciones estáticas, animadas e interactivas en Python. Matplotlib se puede usar en scripts de Python, el shell de Python e IPython, servidores de aplicaciones web y varios kits de herramientas de interfaz gráfica de usuario como Tkinter, awxPython, etc.
Nota: Para obtener más información, consulte Python Matplotlib: descripción general
Pyplot es un módulo de Matplotlib que proporciona una interfaz similar a MATLAB. Matplotlib está diseñado para ser tan útil como MATLAB, con la capacidad de usar Python y la ventaja de ser gratuito y de código abierto.
Nota: Para obtener más información, consulte Pyplot en Matplotlib
matplotlib.pyplot.axvline()
Esta función agrega las líneas verticales a través de los ejes de la trama
Sintaxis:
matplotlib.pyplot.axvline(x=0, ymin=0, ymax=1, **kwargs)Parámetros:
x : posición x en las coordenadas de datos para colocar la línea vertical
ymin : posición inicial de la línea vertical en el eje y, tomará valores entre 0 y 1, siendo 0 la parte inferior del eje, 1 la parte superior del eje
ymax : línea vertical posición final en el eje y, tomará valores entre 0 y 1, siendo 0 la parte inferior del eje, 1 la parte superior del eje
**kwargs: otros parámetros opcionales para cambiar las propiedades de la línea, como
cambiar el color, el ancho de línea, etc.
Ejemplo 1:
# Importing matplotlib.pyplot as plt
import matplotlib.pyplot as plt


# Initialising values of x and y
x =[0, 5, 10, 15, 20]
y =[1, 3, 5, 6, 9]

# Plotting the graph
plt.plot(x, y)

# Drawing red vertical line at
# x = 2.5 starting at half the
#length of y axis(ymin = 0.5) and
#continuing till the end(ymax = 1)
# And setting the color of line to red
plt.axvline(x = 2.5, ymin = 0.5, ymax = 1,
            color ='red')

plt.show()
Producción :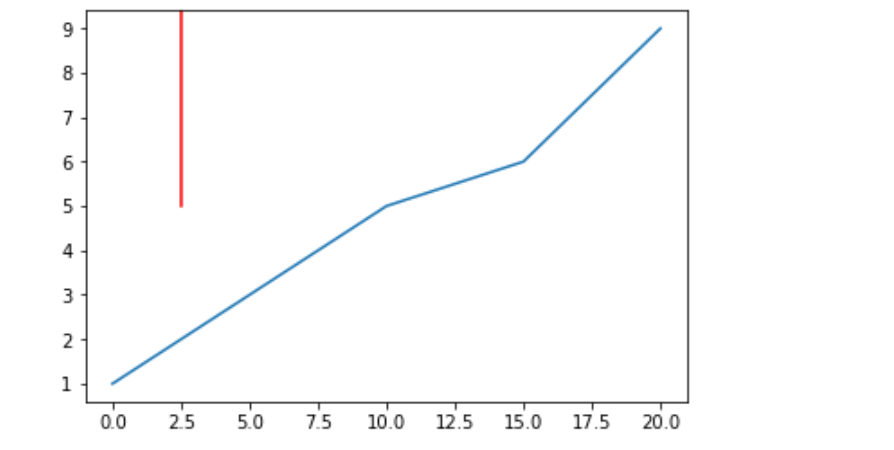
Ejemplo-2:
import matplotlib.pyplot as plt

x =[0, 5, 10, 15, 20]
y =[1, 3, 5, 6, 9]

plt.plot(x, y)
# Drawing vertical line from 25 %
# of the y-axis length to 80 %
# And also increasing the linewidth
plt.axvline(x = 2.5, ymin = 0.25, ymax = 0.80,
            linewidth = 8, color ='green')

plt.show()
Producción: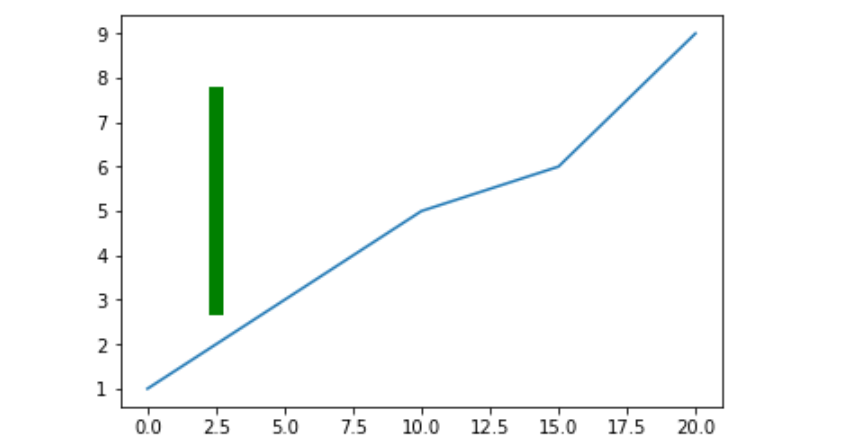
Ejemplo-3:
import matplotlib.pyplot as plt

x =[0, 5, 10, 15, 20]
y =[1, 3, 5, 6, 9]

plt.plot(x, y)

# Drawing vertical line from 25 %
# of the y-axis length to 75 %
# And also changing the linestyle
plt.axvline(x = 2.5, ymin = 0.25, ymax = 0.75,
            linewidth = 4, linestyle ="--",
            color ='red')

plt.show()
Producción: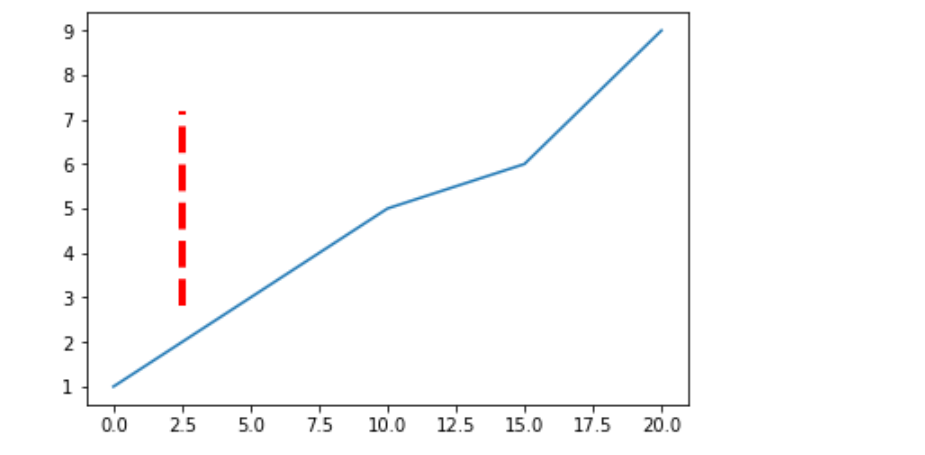
Publicación traducida automáticamente
Artículo escrito por sathvik chiramana y traducido por Barcelona Geeks. The original can be accessed here. Licence: CCBY-SA