Matplotlib es una biblioteca de gráficos para crear visualizaciones estáticas, animadas e interactivas en Python. Pyplot es un módulo de Matplotlib que proporciona una interfaz similar a MATLAB. Matplotlib está diseñado para ser tan útil como MATLAB, con la capacidad de usar Python y la ventaja de ser gratuito y de código abierto.
matplotlib.pyplot.axvspan()
Esta función establece el rectángulo vertical a lo largo de los ejes de la gráfica
Sintaxis: matplotlib.pyplot.axvspan(xmin, xmax, ymin=0, ymax=1, **kwargs)
Parámetros:
xmin : Número que indica la posición inicial del rectángulo vertical en el eje X
xmin : Número que indica la posición final del rectángulo vertical en el eje X ymin
: Posición inicial del rectángulo vertical en el eje y, tomará valores entre 0 y 1 , siendo 0 la parte inferior del eje, 1 siendo la parte superior del eje
ymax : posición final del rectángulo vertical en el eje y, tomará valores entre 0 y 1, siendo 0 la parte inferior del eje, 1 siendo la parte superior del eje
**kwargs : Otros parámetros opcionales para cambiar las propiedades del rectángulo, como cambiar el color, etc.
Ejemplo 1:
# Importing matplotlib.pyplot as plt
import matplotlib.pyplot as plt

# Initializing x and y
x =[1, 15, 27, 48, 50]
y =[1, 12, 22, 45, 67]

# Plotting the graph
plt.plot(x, y)

# Drawing rectangle starting
# x = 5 and extending till x = 20
# With vertical span starting at
# half the length of y-axis(ymin = 0.5)
# And extending till the top of
# axis(ymax = 1)
plt.axvspan(5, 20, ymin = 0.5, ymax = 1)
plt.show()
Producción: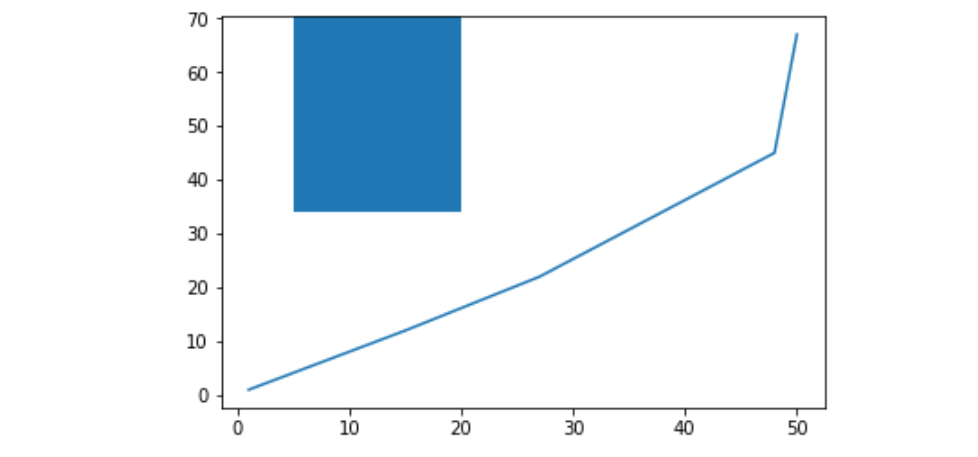
Ejemplo #2:
import matplotlib.pyplot as plt


x =[1, 15, 27, 48, 50]
y =[1, 12, 22, 45, 67]

plt.plot(x, y)

# Drawing rectangle starting
# x = 5 and extending till x = 15
# With vertical span starting at
# 25 % the length of y-axis
# And extending till the 80 % of
# axis And also we are setting
# the color of rectangle to yellow
# and its edge color to blue
plt.axvspan(5, 15, ymin = 0.25,
            ymax = 0.80, ec ='blue',
            color ='yellow')

plt.show()
Producción :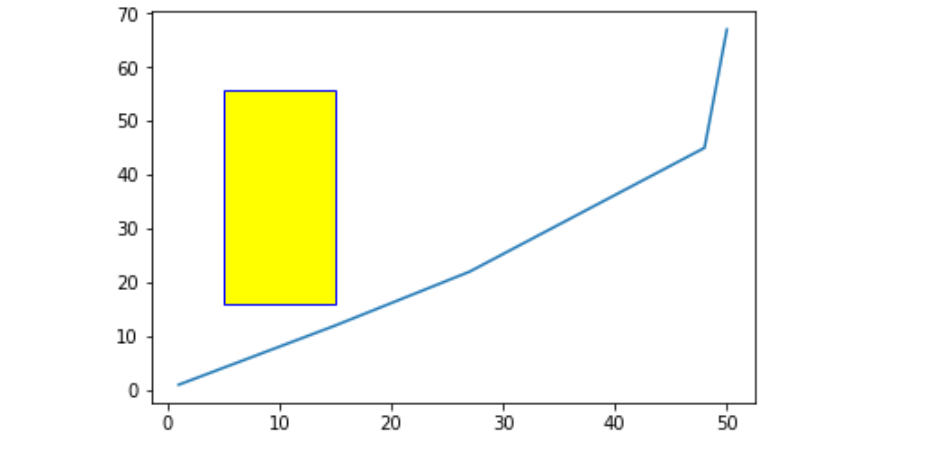
Ejemplo #3:
import matplotlib.pyplot as plt


x =[1, 15, 27, 48, 50]
y =[1, 12, 22, 45, 67]

plt.plot(x, y)

# Setting alpha will make
# the rectangle transparent
plt.axvspan(10, 30, ymin = 0.15,
            ymax = 0.70, ec ='blue',
            color ='yellow',
            alpha = 0.5)

plt.show()
Producción :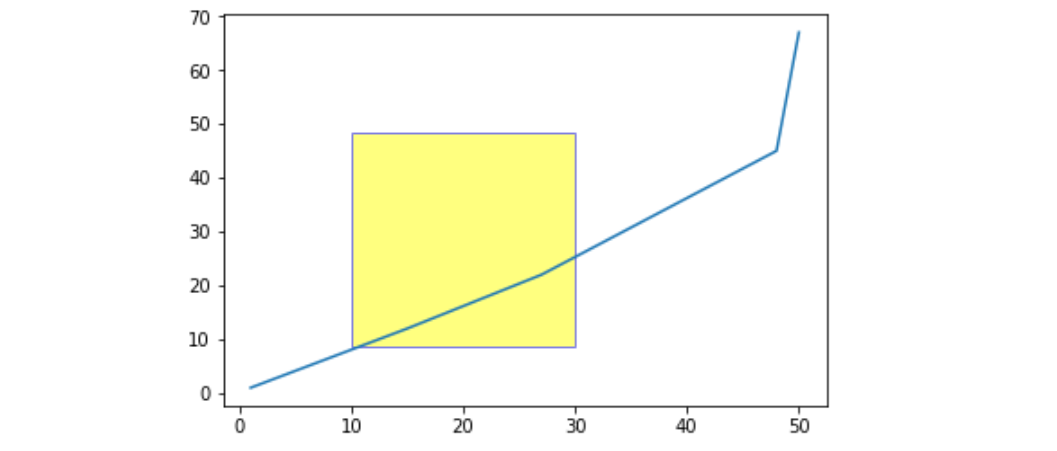
Publicación traducida automáticamente
Artículo escrito por sathvik chiramana y traducido por Barcelona Geeks. The original can be accessed here. Licence: CCBY-SA