Matplotlib es una biblioteca en Python y es una extensión matemática numérica para la biblioteca NumPy. Pyplot es una interfaz basada en estado para un módulo Matplotlib que proporciona una interfaz similar a MATLAB.
función matplotlib.pyplot.contour()
La función de contorno() en el módulo pyplot de la biblioteca matplotlib se usa para trazar contornos.
Sintaxis: matplotlib.pyplot.contour(\*args, data=Ninguno, \*\*kwargs)
Parámetros: Este método acepta los siguientes parámetros que se describen a continuación:
- X, Y: Estos parámetros son las coordenadas de los valores en Z.
- Z : Este parámetro son los valores de altura sobre los que se dibuja el contorno.
- niveles: Este parámetro se utiliza para determinar los números y posiciones de las líneas de contorno/regiones.
Devoluciones: Esto devuelve lo siguiente:
- c: Esto devuelve el
QuadContourSet.
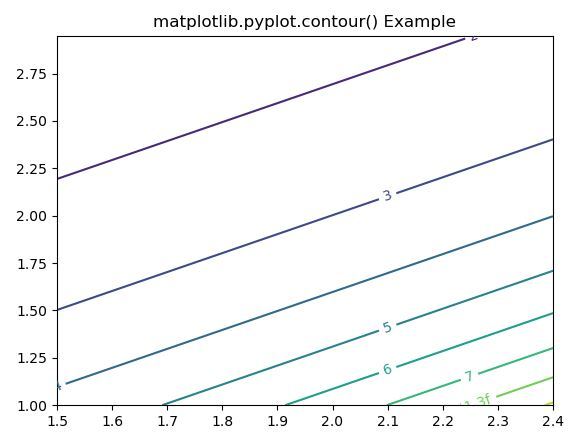
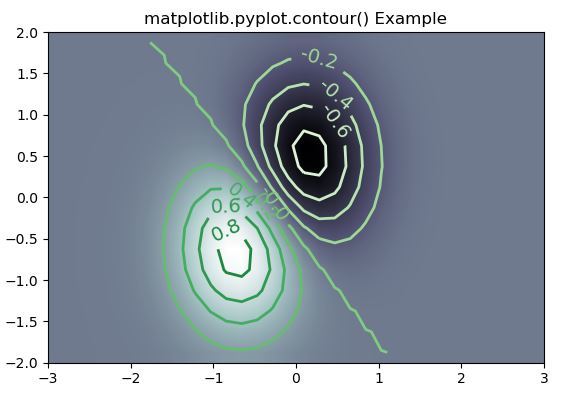
Los siguientes ejemplos ilustran la función matplotlib.pyplot.contour() en matplotlib.pyplot:
Ejemplo 1:
# Implementation of matplotlib function
import numpy as np
import matplotlib.pyplot as plt
import matplotlib.ticker as ticker
import matplotlib

delta = 0.15
x = np.arange(1.5, 2.5, delta)
y = np.arange(1.0, 3.0, delta)
X, Y = np.meshgrid(x, y)
Z = (np.exp(X - Y))


CS1 = plt.contour(X, Y, Z)

fmt = {}
strs = ['1', '2', '3', '4', '5', '6', '7']
for l, s in zip(CS1.levels, strs):
    fmt[l] = s
plt.clabel(CS1, CS1.levels, inline = True,
           fmt = fmt, fontsize = 10)

plt.title('matplotlib.pyplot.contour() Example')
plt.show()
Producción:
Ejemplo #2:
# Implementation of matplotlib function
import matplotlib
import numpy as np
import matplotlib.cm as cm
import matplotlib.pyplot as plt

delta = 0.25
x = np.arange(-3.0, 5.0, delta)
y = np.arange(-1.3, 2.5, delta)
X, Y = np.meshgrid(x, y)
Z = (np.exp(-X**2 - Y**2) - np.exp(-(X - 1)**2 - (Y - 1)**2))

fig, ax = plt.subplots()
im = ax.imshow(Z, interpolation ='bilinear',
               origin ='lower',
               cmap ="bone",
               extent =(-3, 3, -2, 2))

levels = np.arange(-1.2, 1.6, 0.2)
CS = ax.contour(Z, levels,
                origin ='lower',
                cmap ='Greens',
                linewidths = 2,
                extent =(-3, 3, -2, 2))

zc = CS.collections[6]
plt.setp(zc, linewidth = 2)

ax.clabel(CS, levels,
          inline = 1,
          fmt ='% 1.1f',
          fontsize = 14)

plt.title('matplotlib.pyplot.contour() Example')
plt.show()
Producción:
Publicación traducida automáticamente
Artículo escrito por SHUBHAMSINGH10 y traducido por Barcelona Geeks. The original can be accessed here. Licence: CCBY-SA