Matplotlib es una biblioteca en Python y es una extensión matemática numérica para la biblioteca NumPy. Pyplot es una interfaz basada en estado para un módulo Matplotlib que proporciona una interfaz similar a MATLAB.
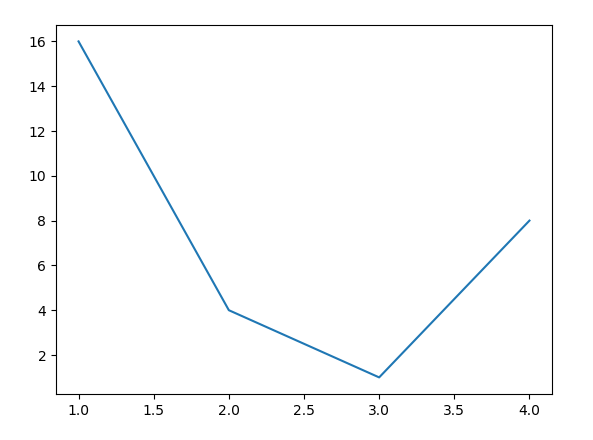
Código de muestra –
# sample code
import matplotlib.pyplot as plt

plt.plot([1, 2, 3, 4], [16, 4, 1, 8])
plt.show()
Producción:
función matplotlib.pyplot.show()
La función show() en el módulo pyplot de la biblioteca matplotlib se usa para mostrar todas las figuras.
Sintaxis:
matplotlib.pyplot.show(*args, **kw)Parámetros: este método acepta solo un parámetro que se analiza a continuación:
- block : este parámetro se usa para anular el comportamiento de bloqueo descrito anteriormente.
Devoluciones: este método no devuelve ningún valor.
Los siguientes ejemplos ilustran la función matplotlib.pyplot.show() en matplotlib.pyplot:
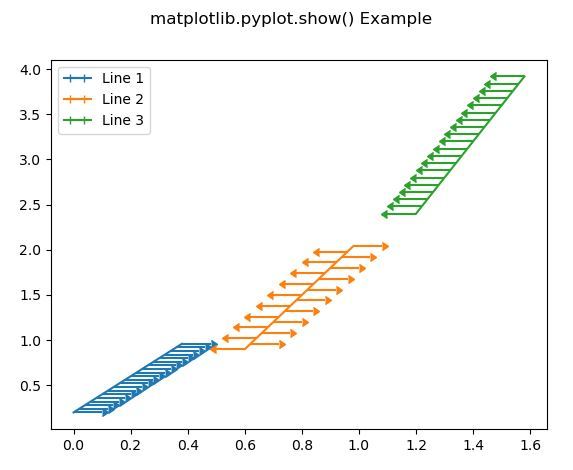
Ejemplo 1:
# Implementation of matplotlib function
import matplotlib.pyplot as plt
import numpy as np

fig = plt.figure()
x = np.arange(20) / 50
y = (x + 0.1)*2

val1 = [True, False] * 10
val2 = [False, True] * 10

plt.errorbar(x, y,
             xerr = 0.1,
             xlolims = True,
             label ='Line 1')

y = (x + 0.3)*3

plt.errorbar(x + 0.6, y,
             xerr = 0.1,
             xuplims = val1,
             xlolims = val2,
             label ='Line 2')

y = (x + 0.6)*4
plt.errorbar(x + 1.2, y,
             xerr = 0.1,
             xuplims = True,
             label ='Line 3')

plt.legend()

fig.suptitle('matplotlib.pyplot.show() Example')
plt.show()
Producción:
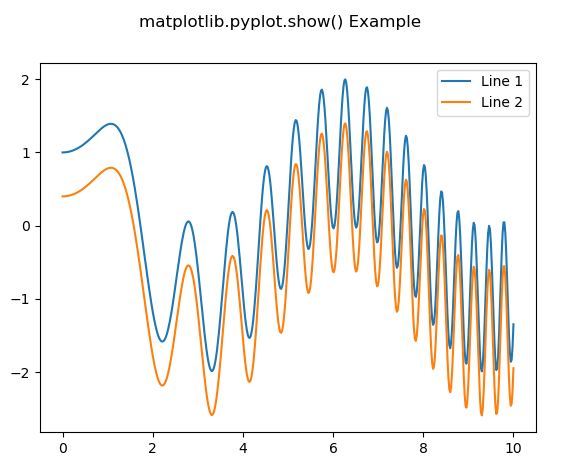
Ejemplo #2:
# Implementation of matplotlib function
import numpy as np
import matplotlib.pyplot as plt

x = np.linspace(0, 10, 500)
y = np.sin(x**2)+np.cos(x)

fig, ax = plt.subplots()

ax.plot(x, y, label ='Line 1')

ax.plot(x, y - 0.6, label ='Line 2')

ax.legend()

fig.suptitle('matplotlib.pyplot.show() Example')
plt.show()
Producción:
Publicación traducida automáticamente
Artículo escrito por SHUBHAMSINGH10 y traducido por Barcelona Geeks. The original can be accessed here. Licence: CCBY-SA