Cuando dibujamos gráficos usando Matplotlib, las marcas y las etiquetas a lo largo del eje x y el eje y también se dibujan. Para dibujar gráficos creativos, muchas veces ocultamos el eje x y el eje y.
¿Cómo ocultar el eje en la figura de matplotlib ?
El comando matplotlib.pyplot.axis(‘off’) que usamos para ocultar el eje (tanto el eje x como el eje y) en la figura de matplotlib.
Ejemplo:
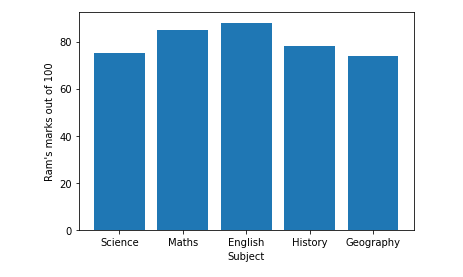
Consideremos la siguiente figura en la que tenemos que ocultar el eje.
Python3
# code
import numpy as np
import matplotlib.pyplot as plt

# Marks of RAM in different subjects out of 100.
x = ['Science', 'Maths', 'English', 'History', 'Geography']
y = [75, 85, 88, 78, 74]

plt.bar(x, y)
plt.xlabel("Subject")
plt.ylabel("Ram's marks out of 100")
plt.show()
Producción:
Ejemplo:
Ocultando el eje en la figura anterior.
Python3
# code
import numpy as np
import matplotlib.pyplot as plt

# Marks of RAM in different subjects out of 100.
x = ['Science', 'Maths', 'English', 'History', 'Geography']
y = [75, 85, 88, 78, 74]

plt.xlabel("Subject")
plt.ylabel("Ram's marks out of 100")
plt.bar(x, y)
plt.axis('off')  # command for hiding the axis.

plt.show()
Producción:

Si solo queremos desactivar el eje X o el eje Y, podemos usar el método plt.xticks() o plt.yticks() respectivamente.
Ejemplo:
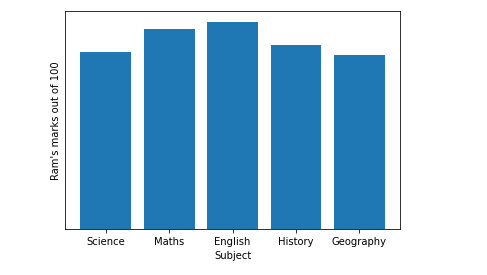
Ocultar el eje Y
Python3
# Hiding Y-axis label
import numpy as np
import matplotlib.pyplot as plt

# Marks of RAM in different subjects out of 100.
x = ['Science', 'Maths', 'English', 'History', 'Geography']
y = [75, 85, 88, 78, 74]

plt.bar(x, y)
plt.xlabel("Subject")
plt.ylabel("Ram's marks out of 100")
plt.yticks([])  # Command for hiding y-axis

plt.show()
Producción:
Ejemplo:
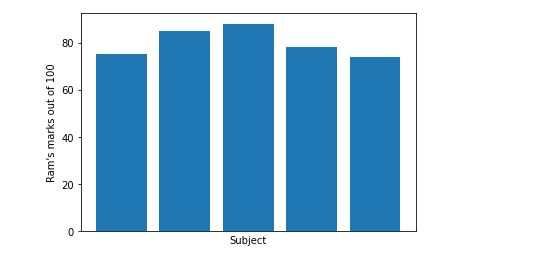
Ocultar el eje X
Python3
# Hiding X-axis
import numpy as np
import matplotlib.pyplot as plt

# Marks of RAM in different subjects out of 100.
x = ['Science', 'Maths', 'English', 'History', 'Geography']
y = [75, 85, 88, 78, 74]

plt.bar(x, y)
plt.xlabel("Subject")
plt.ylabel("Ram's marks out of 100")
plt.xticks([])  # Command for hiding x-axis

plt.show()
Producción:
Ocultar los espacios en blanco y los bordes en la figura de Matplotlib
Cuando usamos el comando plt.axis(‘off’) , oculta el eje, pero obtenemos espacios en blanco alrededor del borde de la imagen mientras la guardamos. Para eliminar/ocultar los espacios en blanco alrededor del borde, podemos establecer bbox_inches=’tight’ en el método savefig() .
De manera similar, para eliminar el borde blanco alrededor de la imagen mientras configuramos pad_inches = 0 en el método savefig() .
Ejemplo:
Python3
# code
import numpy as np
import matplotlib.pyplot as plt

# Marks of RAM in different subjects out of 100.
x = ['Science', 'Maths', 'English', 'History', 'Geography']
y = [75, 85, 88, 78, 74]

fig = plt.bar(x, y)
plt.xlabel("Subject")
plt.ylabel("Ram's marks out of 100")
plt.axis('off')
# Command used for hiding whitespaces and border.
plt.savefig('image.png', bbox_inches='tight', pad_inches=0)

plt.show()
Producción:
Nota: Si ha notado que cuando usamos plt.axis(‘off’) automáticamente oculta el eje, los espacios en blanco y los bordes.
Publicación traducida automáticamente
Artículo escrito por tusharbhadak y traducido por Barcelona Geeks. The original can be accessed here. Licence: CCBY-SA