En palabras simples, la prueba de hipótesis de permutación en R es una forma de comparar un valor numérico de 2 grupos. La prueba de hipótesis de permutación es una alternativa a:
- Prueba t independiente de dos muestras
- Prueba de suma de rangos de Mann-Whitney U, también conocida como Wilcoxon
Implementemos esta prueba en la programación R.
¿ Por qué utilizar la Prueba de Hipótesis de Permutación?
- Tamaño de muestra pequeño.
- No se cumplen los supuestos (para el enfoque paramétrico).
- Pruebe algo diferente a los enfoques clásicos comparando Medias y Medianas.
- Difícil estimar el SE para la estadística de prueba.
Pasos de la prueba de hipótesis de permutación
- Especificar una hipótesis
- Elija test-stat (por ejemplo: media, mediana, etc.)
- Determinar la distribución de test-stat
- Convertir test-stat a valor P
Nota:
Valor P = N.º de permutaciones que tienen un valor de prueba-estado mayor que el valor de prueba-estado observado/N.º de permutaciones.
Implementación en R
- Conjunto de datos: la descarga
- Hipótesis: El peso del
Test-Estadísticas
- diferenciaindependientedos muestras
- Test-Statistics #2: El valor absoluto de la diferencia en los pesos medianos para las dos dietas
R
# R program to illustrate
# Permutation Hypothesis Test
# load the data set
d <- read.table(file = "ChickData.csv",
header = T, sep = ",")
# print the dataset
print(d)
# check the names
names(d)
levels(d$feed)
# how many observations in each diet?
table(d$feed)
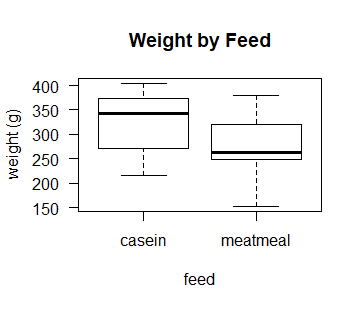
# let's look at a boxplot of weight gain by those 2 diets
boxplot(d$weight~d$feed, las = 1,
ylab = "weight (g)",
xlab = "feed",
main = "Weight by Feed")
# calculate the difference in sample MEANS
mean(d$weight[d$feed == "casein"]) # mean for casein
mean(d$weight[d$feed == "meatmeal"]) # mean for meatmeal
# lets calculate the absolute diff in means
test.stat1 <- abs(mean(d$weight[d$feed == "casein"]) -
mean(d$weight[d$feed == "meatmeal"]))
test.stat1
# calculate the difference in sample MEDIANS
median(d$weight[d$feed == "casein"]) # median for casein
median(d$weight[d$feed == "meatmeal"]) # median for meatmeal
# lets calculate the absolute diff in medians
test.stat2 <- abs(median(d$weight[d$feed == "casein"]) -
median(d$weight[d$feed == "meatmeal"]))
test.stat2
# Permutation Test
# for reproducability of results
set.seed(1979)
# the number of observations to sample
n <- length(d$feed)
# the number of permutation samples to take
P <- 100000
# the variable we will resample from
variable <- d$weight
# initialize a matrix to store the permutation data
PermSamples <- matrix(0, nrow = n, ncol = P)
# each column is a permutation sample of data
# now, get those permutation samples, using a loop
# let's take a moment to discuss what that code is doing
for(i in 1:P)
{
PermSamples[, i] <- sample(variable,
size = n,
replace = FALSE)
}
# we can take a quick look at the first 5 columns of PermSamples
PermSamples[, 1:5]
# initialize vectors to store all of the Test-stats
Perm.test.stat1 <- Perm.test.stat2 <- rep(0, P)
# loop thru, and calculate the test-stats
for (i in 1:P)
{
# calculate the perm-test-stat1 and save it
Perm.test.stat1[i] <- abs(mean(PermSamples[d$feed == "casein",i]) -
mean(PermSamples[d$feed == "meatmeal",i]))
# calculate the perm-test-stat2 and save it
Perm.test.stat2[i] <- abs(median(PermSamples[d$feed == "casein",i]) -
median(PermSamples[d$feed == "meatmeal",i]))
}
# before going too far with this,
# let's remind ourselves of
# the TEST STATS
test.stat1; test.stat2
# and, take a look at the first 15
# permutation-TEST STATS for 1 and 2
round(Perm.test.stat1[1:15], 1)
round(Perm.test.stat2[1:15], 1)
# and, let's calculate the permutation p-value
# notice how we can ask R a true/false question
(Perm.test.stat1 >= test.stat1)[1:15]
# and if we ask for the mean of all of those,
# it treats 0 = FALSE, 1 = TRUE
mean((Perm.test.stat1 >= test.stat1)[1:15])
# Calculate the p-value, for all P = 100,000
mean(Perm.test.stat1 >= test.stat1)
# and, let's calculate the p-value for
# option 2 of the test statistic (abs diff in medians)
mean(Perm.test.stat2 >= test.stat2)
Producción:
> print(d)
    weight  feed
1     325 meatmeal
2     257 meatmeal
3     303 meatmeal
4     315 meatmeal
5     380 meatmeal
6     153 meatmeal
7     263 meatmeal
8     242 meatmeal
9     206 meatmeal
10    344 meatmeal
11    258 meatmeal
12    368   casein
13    390   casein
14    379   casein
15    260   casein
16    404   casein
17    318   casein
18    352   casein
19    359   casein
20    216   casein
21    222   casein
22    283   casein
23    332   casein
> names(d)
[1] "weight" "feed"
> levels(d$feed)
[1] "casein"   "meatmeal"
> table(d$feed)
casein meatmeal
  12       11
> mean(d$weight[d$feed == "casein"]) # mean for casein
[1] 323.5833
> mean(d$weight[d$feed == "meatmeal"]) # mean for meatmeal
[1] 276.9091
> test.stat1
[1] 46.67424
> median(d$weight[d$feed == "casein"]) # median for casein
[1] 342
> median(d$weight[d$feed == "meatmeal"]) # median for meatmeal
[1] 263
> test.stat2
[1] 79
> PermSamples[, 1:5]
      [,1] [,2] [,3] [,4] [,5]
 [1,]  379  283  380  352  206
 [2,]  380  303  258  260  380
 [3,]  257  206  379  380  153
 [4,]  283  242  222  404  359
 [5,]  222  260  325  258  258
 [6,]  315  352  153  379  263
 [7,]  352  263  263  325  325
 [8,]  153  325  315  359  216
 [9,]  368  379  344  242  260
[10,]  344  258  368  368  257
[11,]  359  257  206  257  315
[12,]  206  153  404  222  303
[13,]  404  344  303  390  390
[14,]  325  318  318  303  352
[15,]  242  404  332  263  404
[16,]  390  380  257  206  379
[17,]  260  332  216  315  318
[18,]  303  359  352  344  368
[19,]  263  222  242  283  222
[20,]  332  368  260  332  344
[21,]  318  315  283  318  283
[22,]  216  390  390  153  332
[23,]  258  216  359  216  242
> test.stat1; test.stat2
[1] 46.67424
[1] 79
> round(Perm.test.stat1[1:15], 1)
 [1] 17.1 32.4 17.6 47.1 56.1 28.9 31.0 40.8  6.8 13.8  9.1 46.5 28.9 50.9 32.7
> round(Perm.test.stat2[1:15], 1)
 [1] 61.0 75.0  4.5 59.0 78.0 17.0 62.0 38.5  4.5 16.0 23.0 60.5 63.5 75.0 37.0
> (Perm.test.stat1 >= test.stat1)[1:15]
 [1] FALSE FALSE FALSE  TRUE  TRUE FALSE FALSE FALSE FALSE FALSE FALSE FALSE FALSE  TRUE FALSE
> mean((Perm.test.stat1 >= test.stat1)[1:15])
[1] 0.2
> mean(Perm.test.stat1 >= test.stat1)
[1] 0.09959
> mean(Perm.test.stat2 >= test.stat2)
[1] 0.05407
Publicación traducida automáticamente
Artículo escrito por samrat2825 y traducido por Barcelona Geeks. The original can be accessed here. Licence: CCBY-SA