En este artículo veremos cómo podemos normalizar la imagen en el objeto de vista de imagen en PyQTGaph. PyQtGraph es una biblioteca de interfaz de usuario y gráficos para Python que proporciona la funcionalidad comúnmente requerida en el diseño y las aplicaciones científicas. Sus objetivos principales son proporcionar gráficos rápidos e interactivos para mostrar datos (gráficos, videos, etc.). Widget utilizado para mostrar y analizar datos de imágenes. Implementa muchas funciones, como mostrar datos de imágenes en 2D y 3D. Para datos 3D, se muestra un control deslizante del eje z que permite al usuario seleccionar qué cuadro se muestra. Muestra el histograma de los datos de la imagen con una región móvil que define los niveles oscuros/claros, el degradado editable proporciona una tabla de búsqueda de colores, el control deslizante del marco también se puede mover usando las teclas de flecha izquierda/derecha, así como pgpgn, pgn, home y end. En el procesamiento de imágenes, la normalización es un proceso que cambia el rango de valores de intensidad de píxeles. Las aplicaciones incluyen fotografías con poco contraste debido al deslumbramiento, por ejemplo. La normalización a veces se denomina estiramiento de contraste o estiramiento de histograma.
Podemos crear una vista de imagen con la ayuda del comando que se indica a continuación.
# creating a pyqtgraph image view object
imv = pg.ImageView()
Para hacer esto, usamos el método de normalización con el objeto de vista de imagen
Sintaxis: imv.normalize (img)
Argumento: toma numpy ndarray como argumento
Retorno: devuelve numpy ndarray
A continuación se muestra la implementación.
Python3
# importing Qt widgets
from PyQt5.QtWidgets import *

# importing system
import sys

# importing numpy as np
import numpy as np

# importing pyqtgraph as pg
import pyqtgraph as pg
from PyQt5.QtGui import *
from PyQt5.QtCore import *

# Image View class
class ImageView(pg.ImageView):

    # constructor which inherit original
    # ImageView
    def __init__(self, *args, **kwargs):
        pg.ImageView.__init__(self, *args, **kwargs)

class Window(QMainWindow):

    def __init__(self):
        super().__init__()

        # setting title
        self.setWindowTitle("PyQtGraph")

        # setting geometry
        self.setGeometry(100, 100, 600, 500)

        # icon
        icon = QIcon("skin.png")

        # setting icon to the window
        self.setWindowIcon(icon)

        # calling method
        self.UiComponents()

        # showing all the widgets
        self.show()

        # setting fixed size of window
        self.setFixedSize(QSize(600, 500))

    # method for components
    def UiComponents(self):

        # creating a widget object
        widget = QWidget()

        # creating a label
        label = QLabel("Geeksforgeeks Image View")

        # setting minimum width
        label.setMinimumWidth(130)

        # making label do word wrap
        label.setWordWrap(True)

        # setting configuration options
        pg.setConfigOptions(antialias=True)

        # creating image view object
        imv = ImageView()

        # Create random 3D data set with noisy signals
        img = pg.gaussianFilter(np.random.normal(
            size=(200, 200)), (5, 5)) * 20 + 100

        # setting new axis to image
        img = img[np.newaxis, :, :]

        # decay data
        decay = np.exp(-np.linspace(0, 0.3, 100))[:, np.newaxis, np.newaxis]

        # random data
        data = np.random.normal(size=(100, 200, 200))
        data += img * decay
        data += 2

        # adding time-varying signal
        sig = np.zeros(data.shape[0])
        sig[30:] += np.exp(-np.linspace(1, 10, 70))
        sig[40:] += np.exp(-np.linspace(1, 10, 60))
        sig[70:] += np.exp(-np.linspace(1, 10, 30))

        sig = sig[:, np.newaxis, np.newaxis] * 3
        data[:, 50:60, 30:40] += sig

        # Displaying the data and assign each frame a time value from 1.0 to 3.0
        imv.setImage(data, xvals=np.linspace(1., 3., data.shape[0]))

        # Set a custom color map
        colors = [
            (0, 0, 0),
            (4, 5, 61),
            (84, 42, 55),
            (15, 87, 60),
            (208, 17, 141),
            (255, 255, 255)
        ]

        # color map
        cmap = pg.ColorMap(pos=np.linspace(0.0, 1.0, 6), color=colors)

        # setting color map to the image view
        imv.setColorMap(cmap)

        # Creating a grid layout
        layout = QGridLayout()

        # minimum width value of the label
        label.setFixedWidth(130)

        # setting this layout to the widget
        widget.setLayout(layout)

        # adding label in the layout
        layout.addWidget(label, 1, 0)

        # plot window goes on right side, spanning 3 rows
        layout.addWidget(imv, 0, 1, 3, 1)

        # setting this widget as central widget of the main window
        self.setCentralWidget(widget)

        # normalize the image data
        nor = imv.normalize(data)

        # setting image to image view
        imv.setImage(nor)

# create pyqt5 app
App = QApplication(sys.argv)

# create the instance of our Window
window = Window()

# start the app
sys.exit(App.exec())
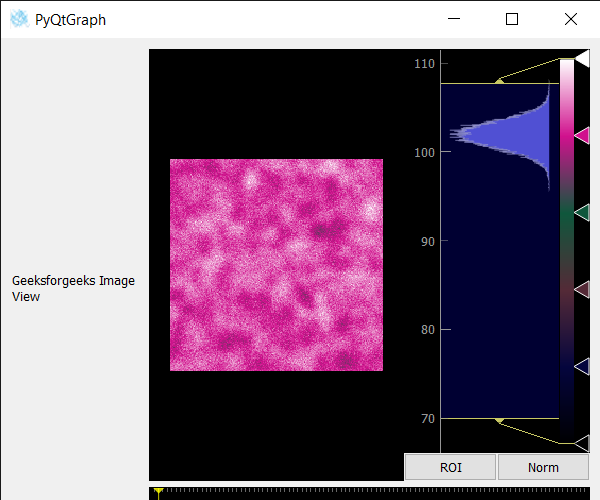
Producción :
Publicación traducida automáticamente
Artículo escrito por rakshitarora y traducido por Barcelona Geeks. The original can be accessed here. Licence: CCBY-SA