En este artículo, veremos cómo podemos obtener un widget de vista del gráfico de diagrama de dispersión del módulo PyQtGraph. PyQtGraph es una biblioteca de interfaz de usuario y gráficos para Python que proporciona la funcionalidad comúnmente requerida en el diseño y las aplicaciones científicas. Sus objetivos principales son proporcionar gráficos rápidos e interactivos para mostrar datos (gráficos, videos, etc.). Un diagrama de dispersión (también conocido como gráfico de dispersión, gráfico de dispersión) usa puntos para representar valores para dos variables numéricas diferentes. Es un tipo de gráfico o diagrama matemático que utiliza coordenadas cartesianas para mostrar valores de normalmente dos variables para un conjunto de datos. La posición de cada punto en el eje horizontal y vertical indica valores para un punto de datos individual. Ver widget es el widget que utiliza el diagrama de dispersión para mostrar el gráfico en la pantalla. Si la escena tiene varias vistas,
Podemos crear una ventana de trazado y crear un gráfico de dispersión en ella con la ayuda de los comandos que se indican a continuación.
# creating a pyqtgraph plot window
plt = pg.plot()

# creating a scatter plot graph of size = 10
scatter = pg.ScatterPlotItem(size=10)
Para hacer esto, usamos el método getViewWidget con el objeto de gráfico de diagrama de dispersión
Sintaxis: scatter.getViewWidget()
Argumento: no requiere argumento
Retorno: devuelve el objeto Vista
A continuación se muestra la implementación.
Python3
# importing Qt widgets
from PyQt5.QtWidgets import *
# importing system
import sys
# importing numpy as np
import numpy as np
# importing pyqtgraph as pg
import pyqtgraph as pg
from PyQt5.QtGui import *
from PyQt5.QtCore import *
class Window(QMainWindow):
def __init__(self):
super().__init__()
# setting title
self.setWindowTitle("PyQtGraph")
# setting geometry
self.setGeometry(100, 100, 600, 500)
# icon
icon = QIcon("skin.png")
# setting icon to the window
self.setWindowIcon(icon)
# calling method
self.UiComponents()
# showing all the widgets
self.show()
# method for components
def UiComponents(self):
# creating a widget object
widget = QWidget()
# creating a label
label = QLabel("Geeksforgeeks Scatter Plot")
# making label do word wrap
label.setWordWrap(True)
# creating a plot window
plot = pg.plot()
# number of points
n = 300
# creating a scatter plot item
# of size = 10
# using brush to enlarge the of green color
scatter = pg.ScatterPlotItem(
size=10, brush=pg.mkBrush(30, 255, 35, 255))
# data for x-axis
x_data = [1, 2, 3, 4, 5, 6, 7, 8, 9, 10]
# data for y-axis
y_data = [5, 4, 6, 4, 3, 5, 6, 6, 7, 8]
# setting data to the scatter plot
scatter.setData(x_data, y_data)
# add item to plot window
# adding scatter plot item to the plot window
plot.addItem(scatter)
# Creating a grid layout
layout = QGridLayout()
# minimum width value of the label
label.setMinimumWidth(130)
# setting this layout to the widget
widget.setLayout(layout)
# adding label in the layout
layout.addWidget(label, 1, 0)
# plot window goes on right side, spanning 3 rows
layout.addWidget(plot, 0, 1, 3, 1)
# setting this widget as central widget of the main window
self.setCentralWidget(widget)
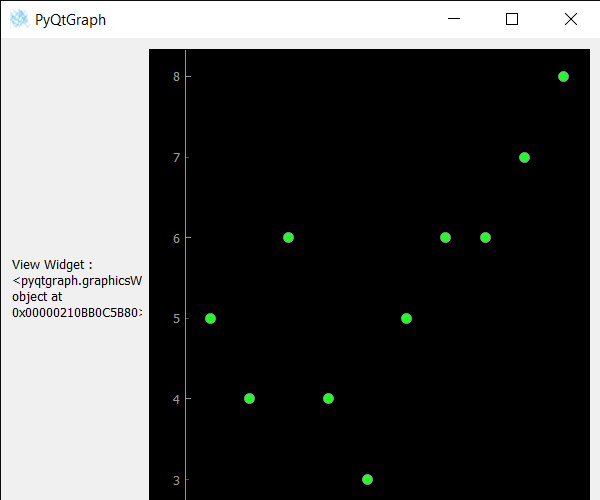
# getting view widget of the scatter plot
value = scatter.getViewWidget()
# setting text to the value
label.setText("View Widget : " + str(value))
# create pyqt5 app
App = QApplication(sys.argv)
# create the instance of our Window
window = Window()
# start the app
sys.exit(App.exec())
Producción:
Publicación traducida automáticamente
Artículo escrito por rakshitarora y traducido por Barcelona Geeks. The original can be accessed here. Licence: CCBY-SA