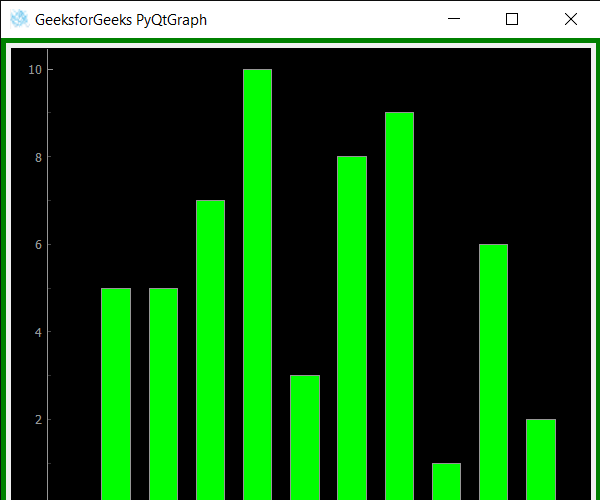
En este artículo veremos cómo podemos obtener la hoja de estilo de la ventana de trazado en el módulo PyQtGraph. PyQtGraph es una biblioteca de interfaz de usuario y gráficos para Python que proporciona la funcionalidad comúnmente requerida en el diseño y las aplicaciones científicas. Sus objetivos principales son proporcionar gráficos rápidos e interactivos para mostrar datos (gráficos, videos, etc.) y, en segundo lugar, proporcionar herramientas para ayudar en el desarrollo rápido de aplicaciones (por ejemplo, árboles de propiedades como los que se usan en Qt Designer). Las ventanas de gráficos consisten en de dos partes principales: el Panel de trazado que contiene los gráficos trazados reales y el Panel de control. La hoja de estilo es la hoja que define el diseño visual de la ventana, por ejemplo, el borde, el color, etc. Se puede configurar con la ayuda del setStyleSheetmétodo.
Podemos crear una ventana de trazado con la ayuda del comando que se indica a continuación.
# creating a pyqtgraph plot window
window = pg.plot()
Para hacer esto, usamos
styleSheetel método con el objeto de la ventana de trazado.Sintaxis: ventana.styleSheet()
Argumento: no requiere argumento
Retorno: Devuelve string
A continuación se muestra la implementación.
# importing QtGui to use QIcon
from PyQt5.QtGui import *

# importing pyqtgraph as pg
import pyqtgraph as pg

# importing QtCore and QtGui from the pyqtgraph module
from pyqtgraph.Qt import QtCore, QtGui

# importing numpy as np
import numpy as np

import time

# creating a pyqtgraph plot window
window = pg.plot()

# icon for plot window
icon = QIcon("logo.png")

# setting icon to the plot window
window.setWindowIcon(icon)

# setting window geometry
# left = 100, top = 100
# width = 600, height = 500
window.setGeometry(100, 100, 600, 500)

# title for the plot window
title = "GeeksforGeeks PyQtGraph"

# setting window title to plot window
window.setWindowTitle(title)

# create list for y-axis
y1 = [5, 5, 7, 10, 3, 8, 9, 1, 6, 2]

# create horizontal list i.e x-axis
x = [1, 2, 3, 4, 5, 6, 7, 8, 9, 10]

# create pyqt5graph bar graph item
# with width = 0.6
# with bar colors = green
bargraph1 = pg.BarGraphItem(x = x, height = y1, width = 0.6, brush ='g')

# add item to plot window
# adding bargraph item to the window
window.addItem(bargraph1)

# setting style sheet to the plot window
window.setStyleSheet("border : 5px solid green;"
                     "padding : 5px;")


# getting style sheet of plot window
value = window.styleSheet()

# printing the value
print("Style Sheet : " + str(value))

# main method
if __name__ == '__main__':

    # importing system
    import sys

    # Start Qt event loop unless running in interactive mode or using
    if (sys.flags.interactive != 1) or not hasattr(QtCore, 'PYQT_VERSION'):
        QtGui.QApplication.instance().exec_()
Producción :
Style Sheet : border : 5px solid green;padding : 5px;
Publicación traducida automáticamente
Artículo escrito por rakshitarora y traducido por Barcelona Geeks. The original can be accessed here. Licence: CCBY-SA