En este artículo, veremos cómo podemos obtener los datos del eje x o del eje y cubiertos por el elemento del gráfico en PyQTGaph. PyQtGraph es una biblioteca de interfaz de usuario y gráficos para Python que proporciona la funcionalidad comúnmente requerida en el diseño y las aplicaciones científicas. Sus objetivos principales son proporcionar gráficos rápidos e interactivos para mostrar datos (gráficos, videos, etc.). Un gráfico es una estructura de datos no lineal que consta de Nodes y bordes. Los Nodes a veces también se conocen como vértices y los bordes son líneas o arcos que conectan dos Nodes en el gráfico. El gráfico consta de un conjunto finito de vértices (o Nodes) y un conjunto de bordes que conectan un par de Nodes. Los límites de datos son el rango del eje que está ocupado por el elemento del gráfico.
Podemos crear un widget de diseño gráfico y un elemento gráfico con la ayuda del comando que se indica a continuación
# creating graphics layout widget
win = pg.GraphicsLayoutWidget()

# creating a graph item
graph_item = pg.GraphItem()
Para hacer esto, usamos el método dataBounds con el objeto del elemento gráfico.
Sintaxis: imv.dataBounds (0)
Argumento: toma 0 para el eje x y 1 para el eje y como argumento
Retorno: devuelve tupla
A continuación se muestra la implementación.
Python3
# importing Qt widgets
from PyQt5.QtWidgets import *
# importing system
import sys
# importing numpy as np
import numpy as np
# importing pyqtgraph as pg
import pyqtgraph as pg
from PyQt5.QtGui import *
from PyQt5.QtCore import *
import pyqtgraph.ptime as ptime
# Image View class
class ImageView(pg.ImageView):
# constructor which inherit original
# ImageView
def __init__(self, *args, **kwargs):
pg.ImageView.__init__(self, *args, **kwargs)
class Window(QMainWindow):
def __init__(self):
super().__init__()
# setting title
self.setWindowTitle("PyQtGraph")
# setting geometry
self.setGeometry(100, 100, 600, 500)
# icon
icon = QIcon("skin.png")
# setting icon to the window
self.setWindowIcon(icon)
# calling method
self.UiComponents()
# showing all the widgets
self.show()
# method for components
def UiComponents(self):
# creating a widget object
widget = QWidget()
# creating a label
label = QLabel("Geeksforgeeks Graph Item")
# setting minimum width
label.setMinimumWidth(130)
# making label do word wrap
label.setWordWrap(True)
# setting configuration options
pg.setConfigOptions(antialias=True)
# creating graphics layout widget
win = pg.GraphicsLayoutWidget()
# adding view box to the graphic layout widget
view = win.addViewBox()
# lock the aspect ratio
view.setAspectLocked()
# creating a graph item
graph_item = pg.GraphItem()
# adding graph item to the view box
view.addItem(graph_item)
# Define positions of nodes
pos = np.array([
[0, 0],
[10, 0],
[0, 10],
[10, 10],
[5, 5],
[15, 5]
])
# Define the set of connections in the graph
adj = np.array([
[0, 1],
[1, 3],
[3, 2],
[2, 0],
[1, 5],
[3, 5],
])
# Define the symbol to use for each node (this is optional)
symbols = ['o', 'x', 'o', 'o', 't', '+']
# Define the line style for each connection (this is optional)
lines = np.array([
(255, 0, 0, 255, 1),
(255, 0, 255, 255, 2),
(255, 0, 255, 255, 3),
(255, 255, 0, 255, 2),
(255, 0, 0, 255, 1),
(255, 255, 255, 255, 4),
], dtype=[('red', np.ubyte), ('green', np.ubyte), ('blue', np.ubyte), ('alpha', np.ubyte), ('width', float)])
# Update the graph
graph_item.setData(pos=pos, adj=adj, pen=lines, size=1, symbol=symbols, pxMode=False)
# Creating a grid layout
layout = QGridLayout()
# minimum width value of the label
label.setMinimumWidth(130)
# setting this layout to the widget
widget.setLayout(layout)
# adding label in the layout
layout.addWidget(label, 1, 0)
# plot window goes on right side, spanning 3 rows
layout.addWidget(win, 0, 1, 3, 1)
# setting this widget as central widget of the main window
self.setCentralWidget(widget)
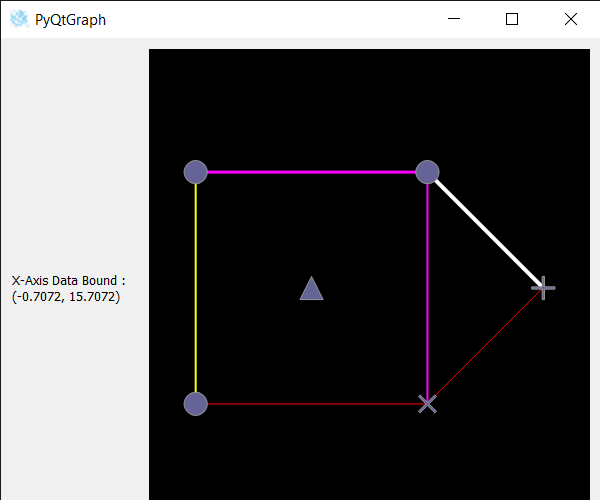
# getting x-axis data bound for graph item
value = graph_item.dataBounds(0)
# setting text to the label
label.setText("X-Axis Data Bound : " + str(value))
# create pyqt5 app
App = QApplication(sys.argv)
# create the instance of our Window
window = Window()
# start the app
sys.exit(App.exec())
Producción :
Publicación traducida automáticamente
Artículo escrito por rakshitarora y traducido por Barcelona Geeks. The original can be accessed here. Licence: CCBY-SA