Bokeh es una visualización de datos interactiva de Python. Representa sus tramas usando HTML y JavaScript. Se dirige a los navegadores web modernos para presentaciones que proporcionan una construcción elegante y concisa de gráficos novedosos con interactividad de alto rendimiento.
Bokeh se puede utilizar para trazar cuadrados con puntos en un gráfico. Se pueden trazar cuadrados con puntos en un gráfico utilizando el square_dot()método del plottingmódulo.
plotting.figure.square_dot()
Sintaxis: punto_cuadrado (parámetros)
Parámetros:
- x : coordenadas x del centro del cuadrado
- y : coordenadas y del centro del cuadrado
Devoluciones: un objeto de clase
GlyphRenderer
Ejemplo 1: En este ejemplo, utilizaremos los valores predeterminados para trazar el gráfico.
# importing the modules
from bokeh.plotting import figure, output_file, show

# file to save the model
output_file("gfg.html")

# instantiating the figure object
graph = figure(title = "Bokeh Square Dot Graph")

# the points to be plotted
x = 0
y = 0

# plotting the graph
graph.square_dot(x, y, size = 30, fill_color = None)

# displaying the model
show(graph)
Producción :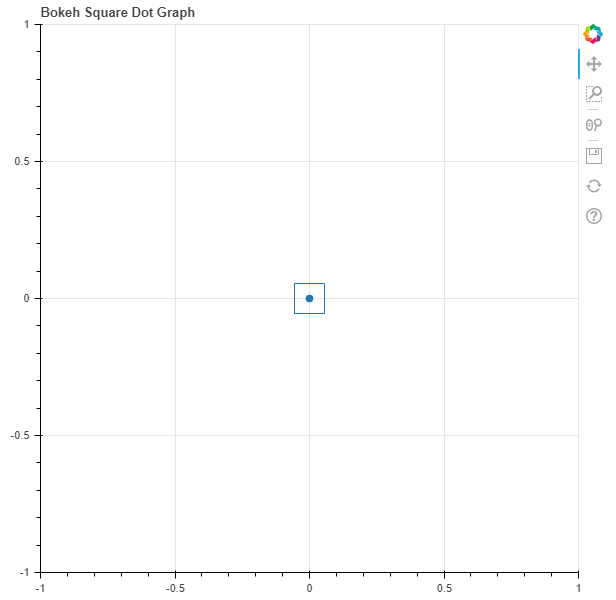
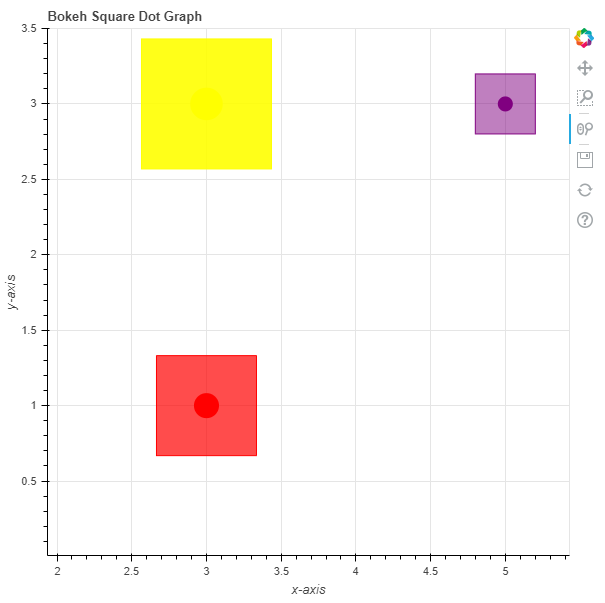
Ejemplo 2: en este ejemplo, trazaremos los cuadrados múltiples con varios otros parámetros
# importing the modules
from bokeh.plotting import figure, output_file, show

# file to save the model
output_file("gfg.html")

# instantiating the figure object
graph = figure(title = "Bokeh Square Dot Graph")

# name of the x-axis
graph.xaxis.axis_label = "x-axis"

# name of the y-axis
graph.yaxis.axis_label = "y-axis"

# points to be plotted
x = [3, 3, 5]
y = [3, 1, 3]
size = [130, 100, 60]

# color value of the square
color = ["yellow", "red", "purple"]

# fill alpha value of the square
fill_alpha = [0.9, 0.7, 0.5]

# plotting the graph
graph.square_dot(x, y,
                 size = size,
                 color = color,
                 fill_alpha = fill_alpha)

# displaying the model
show(graph)
Producción :