Trazar utilizando la API orientada a objetos (OO) en matplotlib es un enfoque fácil para trazar gráficos y otros métodos de visualización de datos.
La sintaxis simple para crear la clase y el objeto para subtrazar es:
nombre_clase, nombre_objeto = matplotlib.pyplot.subplots(‘no_of_rows’, ‘no_of_columns’)
Pongamos algunos ejemplos para que quede más claro.
Ejemplo 1:
# importing the matplotlib library
import matplotlib.pyplot as plt

# defining the values of X
x =[0, 1, 2, 3, 4, 5, 6]

# defining the value of Y
y =[0, 1, 3, 6, 9, 12, 17]

# creating the canvas with class 'fig'
# and it's object 'axes' with '1' row
# and '2' columns
fig, axes = plt.subplots(1, 2)

# plotting graph for 1st column
axes[0].plot(x, y, 'g--o')

# plotting graph for second column
axes[1].plot(y, x, 'm--o')

# Gives a clean look to the graphs
fig.tight_layout()
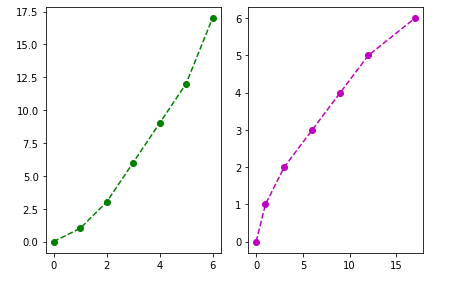
Producción :
En el ejemplo anterior, usamos ‘axes’ (el objeto de la clase ‘fig’) como una array en el momento de trazar el gráfico, porque cuando definimos el número de filas y columnas, se crea una array de objetos con ‘n’ número de elementos donde ‘n’ es el producto de filas y columnas, por lo que si tenemos 2 columnas y dos filas, habrá una array de 4 elementos.
Ejemplo #2:
# importing the matplotlib library
import matplotlib.pyplot as plt

# defining the values of X
x =[0, 1, 2, 3, 4, 5, 6]

# defining the value of Y
y =[0, 1, 3, 6, 9, 12, 17]

# creating the canvas with class 'fig'
# and it's object 'axes' with '1' row
# and '2' columns
fig, axes = plt.subplots(2, 2)

# plotting graph for 1st element
axes[0, 0].plot(x, y, 'g--o')

# plotting graph for 2nd element
axes[0, 1].plot(y, x, 'm--o')

# plotting graph for 3rd element
axes[1, 0].plot(x, y, 'b--o')

# plotting graph for 4th element
axes[1, 1].plot(y, x, 'r--o')

# Gives a clean look to the graphs
fig.tight_layout()
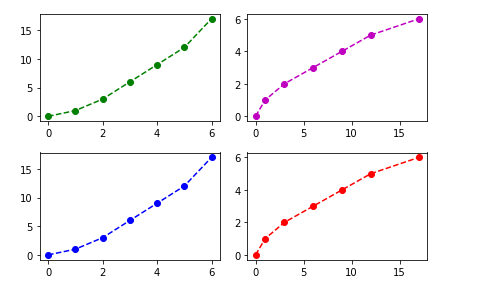
Producción :
Publicación traducida automáticamente
Artículo escrito por harjindersinghs168 y traducido por Barcelona Geeks. The original can be accessed here. Licence: CCBY-SA