La detección de glóbulos blancos y glóbulos rojos es muy útil para diversas aplicaciones médicas, como el recuento de glóbulos blancos, el diagnóstico de enfermedades, etc. La detección circular es el método más adecuado. Este artículo es la implementación de técnicas adecuadas de segmentación de imágenes y extracción de características para la identificación de células sanguíneas, en las imágenes mejoradas obtenidas.
Para explicar el funcionamiento y el uso de Mejora de imagen y Detección de bordes, este artículo utiliza la imagen:
Entrada:
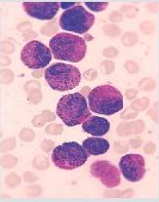
Imagen microscópica de frotis de sangre original
Código: código de Python para la mejora de imágenes
Python3
import numpy as np
import cv2
import matplotlib.pyplot as plt

# read original image
image = cv2.imread("c1.png")

# convert to gray scale image
gray = cv2.cvtColor(image, cv2.COLOR_BGR2GRAY)
cv2.imwrite('gray.png', gray)

# apply median filter for smoothing
blurM = cv2.medianBlur(gray, 5)
cv2.imwrite('blurM.png', blurM)

# apply gaussian filter for smoothing
blurG = cv2.GaussianBlur(gray, (9, 9), 0)
cv2.imwrite('blurG.png', blurG)

# histogram equalization
histoNorm = cv2.equalizeHist(gray)
cv2.imwrite('histoNorm.png', histoNorm)

# create a CLAHE object for
# Contrast Limited Adaptive Histogram Equalization (CLAHE)
clahe = cv2.createCLAHE(clipLimit = 2.0, tileGridSize=(8, 8))
claheNorm = clahe.apply(gray)
cv2.imwrite('claheNorm.png', claheNorm)


# contrast stretching
# Function to map each intensity level to output intensity level.
def pixelVal(pix, r1, s1, r2, s2):
    if (0 <= pix and pix <= r1):
        return (s1 / r1) * pix
    elif (r1 < pix and pix <= r2):
        return ((s2 - s1) / (r2 - r1)) * (pix - r1) + s1
    else:
        return ((255 - s2) / (255 - r2)) * (pix - r2) + s2

    # Define parameters.


r1 = 70
s1 = 0
r2 = 200
s2 = 255

# Vectorize the function to apply it to each value in the Numpy array.
pixelVal_vec = np.vectorize(pixelVal)

# Apply contrast stretching.
contrast_stretched = pixelVal_vec(gray, r1, s1, r2, s2)
contrast_stretched_blurM = pixelVal_vec(blurM, r1, s1, r2, s2)

cv2.imwrite('contrast_stretch.png', contrast_stretched)
cv2.imwrite('contrast_stretch_blurM.png',
            contrast_stretched_blurM)

# edge detection using canny edge detector
edge = cv2.Canny(gray, 100, 200)
cv2.imwrite('edge.png', edge)

edgeG = cv2.Canny(blurG, 100, 200)
cv2.imwrite('edgeG.png', edgeG)

edgeM = cv2.Canny(blurM, 100, 200)
cv2.imwrite('edgeM.png', edgeM)
Salida de imágenes mejoradas:
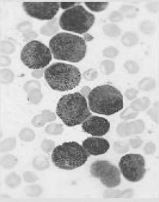
Imagen en escala de grises
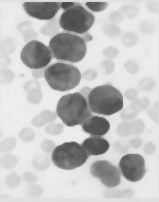
Imagen filtrada mediana
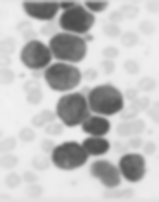
Imagen filtrada gaussiana
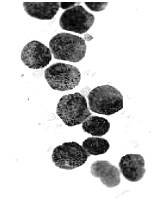
Imagen estirada de contraste
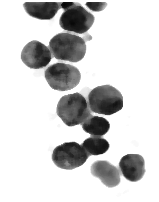
Estiramiento de contraste en la imagen filtrada mediana
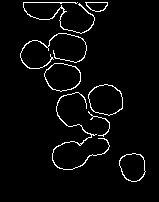
Canny Edge Detección en imagen filtrada gaussiana
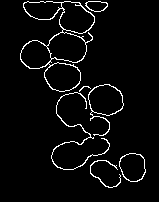
Detección de Canny Edge en la imagen filtrada mediana
Segmentación de imágenes y extracción de características
Python3
# read enhanced image
img = cv2.imread('cell.png', 0)

# morphological operations
kernel = np.ones((5, 5), np.uint8)
dilation = cv2.dilate(img, kernel, iterations = 1)
closing = cv2.morphologyEx(img, cv2.MORPH_CLOSE, kernel)

# Adaptive thresholding on mean and gaussian filter
th2 = cv2.adaptiveThreshold(img, 255, cv2.ADAPTIVE_THRESH_MEAN_C, \
            cv2.THRESH_BINARY, 11, 2)
th3 = cv2.adaptiveThreshold(img, 255, cv2.ADAPTIVE_THRESH_GAUSSIAN_C, \
            cv2.THRESH_BINARY, 11, 2)
# Otsu's thresholding
ret4, th4 = cv2.threshold(img, 0, 255, cv2.THRESH_BINARY + cv2.THRESH_OTSU)

# Initialize the list
Cell_count, x_count, y_count = [], [], []

# read original image, to display the circle and center detection
display = cv2.imread("D:/Projects / ImageProcessing / DA1 / sample1 / cellOrig.png")

# hough transform with modified circular parameters
circles = cv2.HoughCircles(image, cv2.HOUGH_GRADIENT, 1.2, 20,
                           param1 = 50, param2 = 28, minRadius = 1, maxRadius = 20)

# circle detection and labeling using hough transformation
if circles is not None:
        # convert the (x, y) coordinates and radius of the circles to integers
        circles = np.round(circles[0, :]).astype("int")

        # loop over the (x, y) coordinates and radius of the circles
        for (x, y, r) in circles:

                cv2.circle(display, (x, y), r, (0, 255, 0), 2)
                cv2.rectangle(display, (x - 2, y - 2),
                              (x + 2, y + 2), (0, 128, 255), -1)
                Cell_count.append(r)
                x_count.append(x)
                y_count.append(y)
        # show the output image
        cv2.imshow("gray", display)
        cv2.waitKey(0)

# display the count of white blood cells
print(len(Cell_count))
# Total number of radius
print(Cell_count)
# X co-ordinate of circle
print(x_count)
# Y co-ordinate of circle
print(y_count)
Imágenes de salida:
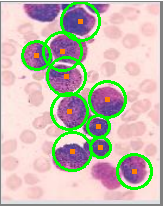
Detección de células sanguíneasq
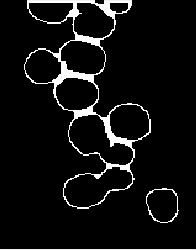
Clausura
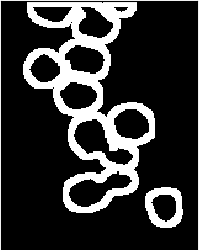
Dilatación
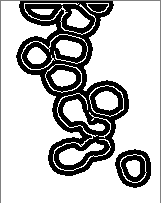
Umbral adaptativo
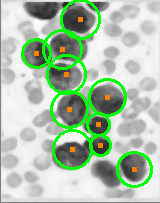
Transformación de Haugh modificada para la detección de círculos
Resumen del proceso completo

Publicación traducida automáticamente
Artículo escrito por vishva_patel y traducido por Barcelona Geeks. The original can be accessed here. Licence: CCBY-SA

