Tensorflow es una biblioteca de aprendizaje automático de código abierto desarrollada por Google. Una de sus aplicaciones es desarrollar redes neuronales profundas.
El módulo tensorflow.mathproporciona soporte para muchas operaciones matemáticas básicas. La función tf.tan()[alias tf.math.tan] brinda soporte para la función tangente en Tensorflow. Espera la entrada en forma de radianes. El tipo de entrada es tensor y si la entrada contiene más de un elemento, se calcula la tangente por elementos.
Sintaxis : tf.tan(x, nombre=Ninguno) o tf.math.tan(x, nombre=Ninguno)
Parámetros :
x : un tensor de cualquiera de los siguientes tipos: float16, float32, float64, complex64 o complex128.
nombre (opcional): el nombre de la operación.Tipo de retorno : Un tensor con el mismo tipo que el de x.
Código #1:
Python3
# Importing the Tensorflow library
import tensorflow as tf

# A constant vector of size 6
a = tf.constant([1.0, -0.5, 3.4, -2.1, 0.0, -6.5],
                               dtype = tf.float32)

# Applying the tan function and
# storing the result in 'b'
b = tf.tan(a, name ='tan')

# Initiating a Tensorflow session
with tf.Session() as sess:
    print('Input type:', a)
    print('Input:', sess.run(a))
    print('Return type:', b)
    print('Output:', sess.run(b))
Producción:
Input type: Tensor("Const:0", shape=(6, ), dtype=float32)
Input: [ 1.  -0.5  3.4 -2.1  0.  -6.5]
Return type: Tensor("tan:0", shape=(6, ), dtype=float32)
Output: [ 1.5574077 -0.5463025  0.264317   1.7098469  0.        -0.2202772]
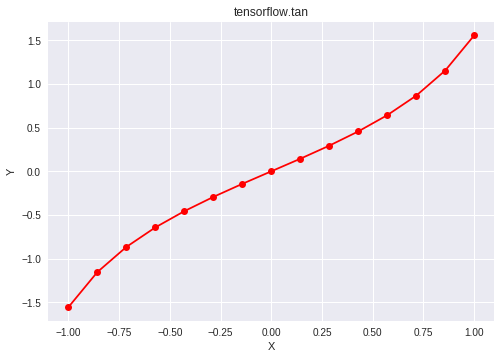
Código #2: Visualización
Python3
# Importing the Tensorflow library
import tensorflow as tf

# Importing the NumPy library
import numpy as np

# Importing the matplotlib.pyplot function
import matplotlib.pyplot as plt

# A vector of size 15 with values from -1 to 1
a = np.linspace(-1, 1, 15)

# Applying the tangent function and
# storing the result in 'b'
b = tf.tan(a, name ='tan')

# Initiating a Tensorflow session
with tf.Session() as sess:
    print('Input:', a)
    print('Output:', sess.run(b))
    plt.plot(a, sess.run(b), color = 'red', marker = "o")
    plt.title("tensorflow.tan")
    plt.xlabel("X")
    plt.ylabel("Y")

    plt.show()
Producción:
Input: [-1.         -0.85714286 -0.71428571 -0.57142857 -0.42857143 -0.28571429
 -0.14285714  0.          0.14285714  0.28571429  0.42857143  0.57142857
  0.71428571  0.85714286  1.        ]
Output: [-1.55740772 -1.15486601 -0.86700822 -0.64298589 -0.45689311 -0.29375136
 -0.14383696  0.          0.14383696  0.29375136  0.45689311  0.64298589
  0.86700822  1.15486601  1.55740772]

Publicación traducida automáticamente
Artículo escrito por vaibhav29498 y traducido por Barcelona Geeks. The original can be accessed here. Licence: CCBY-SA