OpenCV-Python es una biblioteca de enlaces de Python diseñada para resolver problemas de visión por computadora. El método cv2.line() se usa para dibujar una línea en cualquier imagen.
Sintaxis:
cv2.line(image, start_point, end_point, color, thickness)
Parámetros: imagen: Es la imagen sobre la cual se va a dibujar la línea.
- start_point: Son las coordenadas de inicio de la línea. Las coordenadas se representan como tuplas de dos valores, es decir ( valor de la coordenada X , valor de la coordenada Y ).
- end_point: Son las coordenadas finales de la línea. Las coordenadas se representan como tuplas de dos valores, es decir ( valor de la coordenada X , valor de la coordenada Y ).
- color: Es el color de la línea a dibujar. Para RGB , pasamos una tupla. ej.: (255, 0, 0) para el color azul.
- grosor: Es el grosor de la línea en px .
Valor devuelto: Devuelve una imagen.
Implementación:
La imagen utilizada para los ejemplos n1 y 2 es la siguiente:

Ejemplo 1:
Python3
# Python program to explain cv2.line() method

# importing cv2
import cv2

# path
path = r'C:\Users\Rajnish\Desktop\geeksforgeeks\geeks.png'

# Reading an image in default mode
image = cv2.imread(path)

# Window name in which image is displayed
window_name = 'Image'

# Start coordinate, here (0, 0)
# represents the top left corner of image
start_point = (0, 0)

# End coordinate, here (250, 250)
# represents the bottom right corner of image
end_point = (250, 250)

# Green color in BGR
color = (0, 255, 0)

# Line thickness of 9 px
thickness = 9

# Using cv2.line() method
# Draw a diagonal green line with thickness of 9 px
image = cv2.line(image, start_point, end_point, color, thickness)

# Displaying the image
cv2.imshow(window_name, image)
Producción:

Ejemplo #2:
Python3
# Python program to explain cv2.line() method

# importing cv2
import cv2

# path
path = r'C:\Users\Rajnish\Desktop\geeksforgeeks\geeks.png'

# Reading an image in grayscale mode
image = cv2.imread(path, 0)

# Window name in which image is displayed
window_name = 'Image'

# Start coordinate, here (225, 0)
# represents the top right corner of image
start_point = (225, 0)

# End coordinate, here (0, 225)
# represents the bottom left corner of image
end_point = (0, 225)

# Black color in BGR
color = (0, 0, 0)

# Line thickness of 5 px
thickness = 5

# Using cv2.line() method
# Draw a diagonal black line with thickness of 5 px
image = cv2.line(image, start_point, end_point, color, thickness)

# Displaying the image
cv2.imshow(window_name, image)
Producción:

Ejemplo 3: dibujar una línea en una pantalla negra usando la biblioteca numpy:
Python3
import numpy as np
import cv2
# Creating a black screen image using nupy.zeros function
Img = np.zeros((512, 512, 3), dtype='uint8')
# Start coordinate, here (100, 100). It represents the top left corner of image
start_point = (100, 100)
# End coordinate, here (450, 450). It represents the bottom right corner of the image according to resolution
end_point = (450, 450)
# White color in BGR
color = (255, 250, 255)
# Line thickness of 9 px
thickness = 9
# Using cv2.line() method to draw a diagonal green line with thickness of 9 px
image = cv2.line(Img, start_point, end_point, color, thickness)
# Display the image
cv2.imshow('Drawing_Line', image)
cv2.waitKey(0)
cv2.destroyAllWindows()
Producción:
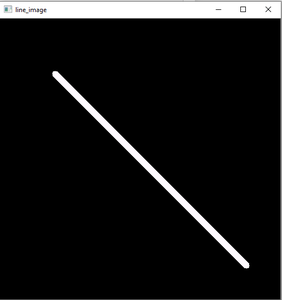
Pantalla negra creada usando numpy y dibujando líneas usando la función cv2.line()