Matplotlib es una increíble biblioteca de visualización en Python para gráficos 2D de arrays. Matplotlib es una biblioteca de visualización de datos multiplataforma basada en arrays NumPy y diseñada para funcionar con la pila SciPy más amplia. Fue presentado por John Hunter en el año 2002.
Uno de los mayores beneficios de la visualización es que nos permite el acceso visual a grandes cantidades de datos en imágenes fácilmente digeribles. Matplotlib consta de varios gráficos como línea, barra, dispersión, histograma, etc.
En este artículo, veremos cómo podemos trabajar con imágenes PNG usando Matplotlib.
Código #1: Lee una imagen PNG usando Matplotlib
# importing pyplot and image from matplotlib
import matplotlib.pyplot as plt
import matplotlib.image as img

# reading png image file
im = img.imread('imR.png')

# show image
plt.imshow(im)
Producción:
Código #2: Aplicar pseudocolor a la imagen
El pseudocolor es útil para mejorar el contraste de la imagen.
# importing pyplot and image from matplotlib
import matplotlib.pyplot as plt
import matplotlib.image as img

# reading png image
im = img.imread('imR.png')

# applying pseudocolor
# default value of colormap is used.
lum = im[:, :, 0]

# show image
plt.imshow(lum)
Producción: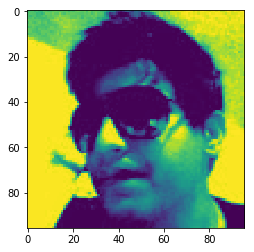
Código n.º 3: podemos proporcionar otro valor al mapa de colores con la barra de colores.
# importing pyplot and image from matplotlib
import matplotlib.pyplot as plt
import matplotlib.image as img

# reading png image
im = img.imread('imR.png')
lum = im[:, :, 0]

# setting colormap as hot
plt.imshow(lum, cmap ='hot')
plt.colorbar()
Producción:
Esquemas de interpolación:
la interpolación calcula cuál debería ser el color o el valor de un píxel y esto es necesario cuando cambiamos el tamaño de la imagen pero queremos la misma información. Falta espacio cuando cambia el tamaño de la imagen porque los píxeles son discretos y la interpolación es la forma de llenar ese espacio.
Código # 4: Interpolación
# importing PIL and matplotlib
from PIL import Image
import matplotlib.pyplot as plt

# reading png image  file
img = Image.open('imR.png')

# resizing the image
img.thumbnail((50, 50), Image.ANTIALIAS)
imgplot = plt.imshow(img)
Producción:
Código #6: Aquí, el valor ‘bicúbico’ se usa para la interpolación.
# importing pyplot from matplotlib
import matplotlib.pyplot as plt

# importing image from PIL
from PIL import Image

# reading image
img = Image.open('imR.png')

img.thumbnail((30, 30), Image.ANTIALIAS)

# bicubic used for interpolation
imgplot = plt.imshow(img, interpolation ='bicubic')
Producción: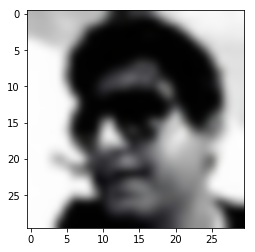
Código #7: el valor ‘sinc’ se usa para la interpolación.
# importing PIL and matplotlib
from PIL import Image
import matplotlib.pyplot as plt

# reading image
img = Image.open('imR.png')

img.thumbnail((30, 30), Image.ANTIALIAS)

# sinc used for interpolation
imgplot = plt.imshow(img, interpolation ='sinc')
Salida: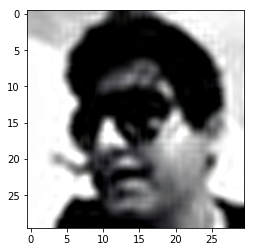
Referencia: https://matplotlib.org/gallery/images_contours_and_fields/interpolation_methods.html
Publicación traducida automáticamente
Artículo escrito por ravikishor y traducido por Barcelona Geeks. The original can be accessed here. Licence: CCBY-SA