Requisito previo: lectura y escritura en una hoja de Excel usando openpyxl Openpyxl es una biblioteca de Python con la que se pueden realizar múltiples operaciones en archivos de Excel como lectura, escritura, operaciones aritméticas y trazado de gráficos. Veamos cómo trazar diferentes gráficos utilizando datos en tiempo real. Los gráficos se componen de al menos una serie de uno o más puntos de datos. Las series en sí mismas se componen de referencias a rangos de celdas. Para trazar los gráficos en una hoja de Excel, en primer lugar, cree un objeto de gráfico de una clase de gráfico específica (es decir, BarChart, LineChart, etc.). Después de crear objetos de gráfico, inserte datos en él y, por último, agregue ese objeto de gráfico en el objeto de hoja.
Código n.º 1: Trazar el gráfico de barras Para trazar el gráfico de barras en una hoja de Excel, utilice la clase BarChart del submódulo openpyxl.chart.
Python3
# import openpyxl module
import openpyxl

# import BarChart class from openpyxl.chart sub_module
from openpyxl.chart import BarChart,Reference

# Call a Workbook() function of openpyxl
# to create a new blank Workbook object
wb = openpyxl.Workbook()

# Get workbook active sheet
# from the active attribute.
sheet = wb.active

# write o to 9 in 1st column of the active sheet
for i in range(10):
    sheet.append([i])

# create data for plotting
values = Reference(sheet, min_col = 1, min_row = 1,
                         max_col = 1, max_row = 10)

# Create object of BarChart class
chart = BarChart()

# adding data to the Bar chart object
chart.add_data(values)

# set the title of the chart
chart.title = " BAR-CHART "

# set the title of the x-axis
chart.x_axis.title = " X_AXIS "

# set the title of the y-axis
chart.y_axis.title = " Y_AXIS "

# add chart to the sheet
# the top-left corner of a chart
# is anchored to cell E2 .
sheet.add_chart(chart, "E2")

# save the file
wb.save("barChart.xlsx")
Salida:  Código #2: Trazar el gráfico de barras 3D Para trazar el gráfico de barras 3D en una hoja de Excel, use la clase BarChart3D del submódulo openpyxl.chart.
Python3
# import openpyxl module
import openpyxl

# import BarChart3D class from openpyxl.chart sub_module
from openpyxl.chart import BarChart3D,Reference

# write o to 9 in 1st column of the active sheet
for i in range(10):
    sheet.append([i])

values = Reference(sheet, min_col = 1, min_row = 1,
                         max_col = 1, max_row = 10)

# Create object of BarChart3D class
chart = BarChart3D()

chart.add_data(values)

# set the title of the chart
chart.title = " BAR-CHART3D "

# set the title of the x-axis
chart.x_axis.title = " X AXIS "

# set the title of the y-axis
chart.y_axis.title = " Y AXIS "

# add chart to the sheet
# the top-left corner of a chart
# is anchored to cell E2.
sheet.add_chart(chart, "E2")

# save the file
wb.save("BarChart3D.xlsx")
Salida:  Código n.º 3: Trazar el gráfico de área Para trazar el gráfico de área en una hoja de Excel, use la clase AreaChart del submódulo openpyxl.chart.
Python3
import openpyxl

# import AreaChart class from openpyxl.chart sub_module
from openpyxl.chart import AreaChart,Reference


wb = openpyxl.Workbook()
sheet = wb.active

# write o to 9 in 1st column of the active sheet
for i in range(10):
    sheet.append([i])

values = Reference(sheet, min_col = 1, min_row = 1,
                         max_col = 1, max_row = 10)

# create object of AreaChart class
chart = AreaChart()

chart.add_data(values)

# set the title of the chart
chart.title = " AREA-CHART "

# set the title of the x-axis
chart.x_axis.title = " X-AXIS "

# set the title of the y-axis
chart.y_axis.title = " Y-AXIS "

# add chart to the sheet
# the top-left corner of a chart
# is anchored to cell E2 .
sheet.add_chart(chart, "E2")

# save the file
wb.save("AreaChart.xlsx")
Salida:  Código #4: Trazar el gráfico de área 3D Para trazar el gráfico de área 3D en una hoja de Excel, use la clase AreaChart3D del submódulo openpyxl.chart.
Python3
import openpyxl

# import AreaChart3D class from openpyxl.chart sub_module
from openpyxl.chart import AreaChart3D,Reference

wb = openpyxl.Workbook()
sheet = wb.active

# write o to 9 in 1st column of the active sheet
for i in range(10):
    sheet.append([i])

values = Reference(sheet, min_col = 1, min_row = 1,
                         max_col = 1, max_row = 10)

# Create object of AreaChart3D class
chart = AreaChart3D()

chart.add_data(values)

# set the title of the chart
chart.title = " AREA-CHART3D "

# set the title of the x-axis
chart.x_axis.title = " X-AXIS "

# set the title of the y-axis
chart.y_axis.title = " Y-AXIS "

# add chart to the sheet
# the top-left corner of a chart
# is anchored to cell E2 .
sheet.add_chart(chart, "E2")

# save the file
wb.save("AreaChart3D.xlsx")
Salida:  Código #5: Trace un gráfico de líneas. Para trazar el gráfico de líneas en una hoja de Excel, use la clase LineChart del submódulo openpyxl.chart.
Python3
# import openpyxl module
import openpyxl

# import LineChart class from openpyxl.chart sub_module
from openpyxl.chart import LineChart,Reference

wb = openpyxl.Workbook()
sheet = wb.active

# write o to 9 in 1st column of the active sheet
for i in range(10):
    sheet.append([i])

values = Reference(sheet, min_col = 1, min_row = 1,
                         max_col = 1, max_row = 10)

# Create object of LineChart class
chart = LineChart()

chart.add_data(values)

# set the title of the chart
chart.title = " LINE-CHART "

# set the title of the x-axis
chart.x_axis.title = " X-AXIS "

# set the title of the y-axis
chart.y_axis.title = " Y-AXIS "

# add chart to the sheet
# the top-left corner of a chart
# is anchored to cell E2 .
sheet.add_chart(chart, "E2")

# save the file
wb.save("LineChart.xlsx")
Salida: 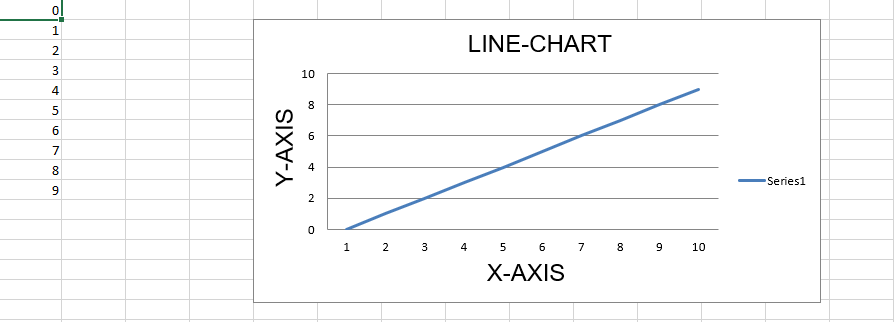 Código #6: Trace un gráfico de líneas 3D. Para trazar el gráfico de líneas 3D en una hoja de Excel, debemos usar la clase LineChart3D del submódulo openpyxl.chart.
Python3
import openpyxl

# import LineChart3D class from openpyxl.chart sub_module
from openpyxl.chart import LineChart3D,Reference

wb = openpyxl.Workbook()
sheet = wb.active

# write o to 9 in 1st column of the active sheet
for i in range(10):
    sheet.append([i])

values = Reference(sheet, min_col = 1, min_row = 1,
                         max_col = 1, max_row = 10)

# Create object of LineChart3D class
chart = LineChart3D()

chart.add_data(values)

# set the title of the chart
chart.title = " LINE-CHART3D "


# set the title of the x-axis
chart.x_axis.title = " X-AXIS "

# set the title of the y-axis
chart.y_axis.title = " Y-AXIS "

# add chart to the sheet
# the top-left corner of a chart
# is anchored to cell E2 .
sheet.add_chart(chart, "E2")

# save the file
wb.save("LineChart3D.xlsx")
Producción: 