Es muy fácil trazar diferentes tipos de mapas y gráficos de diferentes datos usando Python. Una biblioteca tan útil en Python es Matplotlib , que es muy útil para crear diferentes tipos de gráficos utilizando los mismos datos.
La forma más fácil de instalar Matplotlib es usando el comando pip en la línea de comandos como se muestra a continuación:
pip install matplotlib
Además, usamos las bibliotecas numpy y pandas para crear y usar los conjuntos de datos. Por lo tanto, la instalación de la biblioteca numpy y pandas también se puede realizar mediante el comando pip en la línea de comandos.
pip install numpy
pip install pandas
Para hacer gráficos creativos y fáciles de encontrar los datos ubicados dentro del gráfico, utilizamos las bibliotecas plotly y cufflinks . Para utilizar estas bibliotecas, el método de instalación también es el mismo que el de las bibliotecas mencionadas anteriormente.
pip install chart_studio.plotly
pip install cufflinks
En este artículo, crearemos un Plotter que nos permita crear diferentes tipos de gráficos utilizando los mismos datos.
En este programa, primero damos la opción de elegir el conjunto de datos requerido para trazar el gráfico. Hay 3 opciones disponibles para usar sentencias if-elif.
- Creando datos aleatorios usando 100 filas y 5 columnas
- Conjunto de datos de entrada de usuario con 4 filas y 5 columnas
- Cargue el archivo CSV/JSON
El segundo paso es decidir el gráfico que se trazará con todo el conjunto de datos o para columnas específicas. Y, por último, presentamos diferentes tipos de trazadores que los usuarios quieren trazar sus datos y trazar el gráfico en consecuencia.
A continuación se muestra la implementación:
Python3
# importing required libraries
import numpy as np
import pandas as pd
import chart_studio.plotly as pl
import plotly.offline as po
import cufflinks as cf
po.init_notebook_mode(connected = True)
cf.go_offline()

# define a function for creating
# data set for plotting graph
def createdata(data):

    # creating random data set
    if(data == 1):
        x = np.random.rand(100,5)
        df1 = pd.DataFrame(x, columns = ['A', 'B',
                                        'C', 'D',
                                        'E'])

    # creating user data set with input
    elif(data == 2):
        x = [0, 0, 0, 0, 0]
        r1 = [0, 0, 0, 0, 0]
        r2 = [0, 0, 0, 0, 0]
        r3 = [0, 0, 0, 0, 0]
        r4 = [0, 0, 0, 0, 0]

        print('Enter the values for columns')
        i = 0

        for i in [0, 1, 2, 3, 4]:
            x[i] = input()
            i = i + 1
        print('Enter the values for first row')
        i = 0

        for i in [0, 1, 2, 3, 4]:
            r1[i] = int(input())
            i = i + 1

        print('Enter the values for second row')
        i = 0

        for i in [0, 1, 2, 3, 4]:
            r2[i] = int(input())
            i = i + 1

        print('Enter the values for third row')
        i = 0

        for i in [0, 1, 2, 3, 4]:
            r3[i] = int(input())
            i = i + 1

        print('Enter the values for fourth row')
        i = 0

        for i in [0, 1, 2, 3, 4]:
            r4[i] = int(input())
            i = i + 1

        df1 = pd.DataFrame([r1,r2,r3,r4] ,
                           columns = x)
    # creating data set by csv file
    elif(data == 3):
        file = input('Enter the file name')
        x = pd.read_csv(file)
        df1 = pd.DataFrame(x)

    else:
        print('DataFrame creation failed please' +
              'enter in between 1 to 3 and try again')

    return df1

# define a function for
# types of plotters
def plotter(plot):

    if(plot == 1):
        finalplot = df1.iplot(kind = 'scatter')

    elif(plot == 2):
        finalplot = df1.iplot(kind = 'scatter', mode = 'markers',
                              symbol = 'x', colorscale = 'paired')
    elif(plot == 3):
        finalplot = df1.iplot(kind = 'bar')

    elif(plot == 4):
        finalplot = df1.iplot(kind = 'hist')

    elif(plot == 5):
        finalplot = df1.iplot(kind = 'box')

    elif(plot == 6):
        finalplot = df1.iplot(kind = 'surface')

    else:
        finalplot = print('Select only between 1 to 7')

    return finalplot

# define a function for allowing
# to plot for specific rows and columns
def plotter2(plot):

    col = input('Enter the number of columns you' +
                'want to plot by selecting only 1 , 2 or 3')

    col = int(col)

    if(col==1):

        colm = input('Enter the column you want to plot' +
                     'by selecting any column from dataframe head')
        if(plot == 1):
            finalplot = df1[colm].iplot(kind = 'scatter')

        elif(plot == 2):
            finalplot = df1[colm].iplot(kind = 'scatter', mode = 'markers',
                                        symbol = 'x', colorscale = 'paired')
        elif(plot == 3):
            finalplot = df1[colm].iplot(kind = 'bar')

        elif(plot == 4):
            finalplot = df1[colm].iplot(kind = 'hist')

        elif(plot == 5):
            finalplot = df1[colm].iplot(kind = 'box')

        elif(plot == 6 or plot == 7):
            finalplot = print('Bubble plot and surface plot require' +
                              'more than one column arguments')
        else:
            finalplot = print('Select only between 1 to 7')

    elif(col == 2):

        print('Enter the columns you want to plot' +
              'by selecting from dataframe head')

        x = input('First column')
        y = input('Second column')

        if(plot == 1):
            finalplot = df1[[x,y]].iplot(kind = 'scatter')

        elif(plot == 2):
            finalplot = df1[[x,y]].iplot(kind = 'scatter', mode = 'markers',
                                         symbol = 'x', colorscale = 'paired')
        elif(plot == 3):
            finalplot = df1[[x,y]].iplot(kind = 'bar')

        elif(plot == 4):
            finalplot = df1[[x,y]].iplot(kind = 'hist')

        elif(plot == 5):
            finalplot = df1[[x,y]].iplot(kind = 'box')

        elif(plot == 6):
            finalplot = df1[[x,y]].iplot(kind = 'surface')

        elif(plot == 7):
            size = input('Please enter the size column for bubble plot')
            finalplot = df1.iplot(kind = 'bubble', x = x,
                                  y = y, size = size)
        else:
            finalplot = print('Select only between 1 to 7')

    elif(col == 3):

        print('Enter the columns you want to plot')
        x = input('First column')
        y = input('Second column')
        z = input('Third column')

        if(plot == 1):
            finalplot = df1[[x,y,z]].iplot(kind = 'scatter')

        elif(plot == 2):
            finalplot = df1[[x,y,z]].iplot(kind = 'scatter', mode = 'markers',
                                           symbol = 'x' ,colorscale = 'paired')
        elif(plot == 3):
            finalplot = df1[[x,y,z]].iplot(kind = 'bar')

        elif(plot == 4):
            finalplot = df1[[x,y,z]].iplot(kind = 'hist')

        elif(plot == 5):
            finalplot = df1[[x,y,z]].iplot(kind = 'box')

        elif(plot == 6):
            finalplot = df1[[x,y,z]].iplot(kind = 'surface')

        elif(plot == 7):
            size = input('Please enter the size column for bubble plot')

            finalplot = df1.iplot(kind = 'bubble', x = x, y = y,
                                  z = z, size = size )
        else:
            finalplot = print('Select only between 1 to 7')
    else:
        finalplot = print('Please enter only 1 , 2 or 3')
    return finalplot

# define a main function
# for asking type of plot
# and calling respective function
def main(cat):

    if(cat == 1):

        print('Select the type of plot you need to plot by writing 1 to 6')
        print('1.Line plot')
        print('2.Scatter plot')
        print('3.Bar plot')
        print('4.Histogram')
        print('5.Box plot')
        print('6.Surface plot')
        plot = int(input())
        output = plotter(plot)

    elif(cat == 2):

        print('Select the type of plot you need to plot by writing 1 to 7')
        print('1.Line plot')
        print('2.Scatter plot')
        print('3.Bar plot')
        print('4.Histogram')
        print('5.Box plot')
        print('6.Surface plot')
        print('7.Bubble plot')
        plot = int(input())
        output = plotter2(plot)

    else:
        print('Please enter 1 or 2 and try again')

print('Select the type of data you need to plot(By writing 1,2 or 3)')
print('1.Random data with 100 rows and 5 columns')
print('2.Customize dataframe with 5 columns and. 4 rows')
print('3.Upload csv/json/txt file')

data = int(input())
df1 = createdata(data)
print('Your DataFrame head is given below check the columns to plot using cufflinks')

df1.head()
print('What kind of plot you need , the complete data plot or columns plot')
cat = input('Press 1 for plotting all columns or press 2 for specifying columns to plot')
cat = int(cat)

main(cat)
Producción:
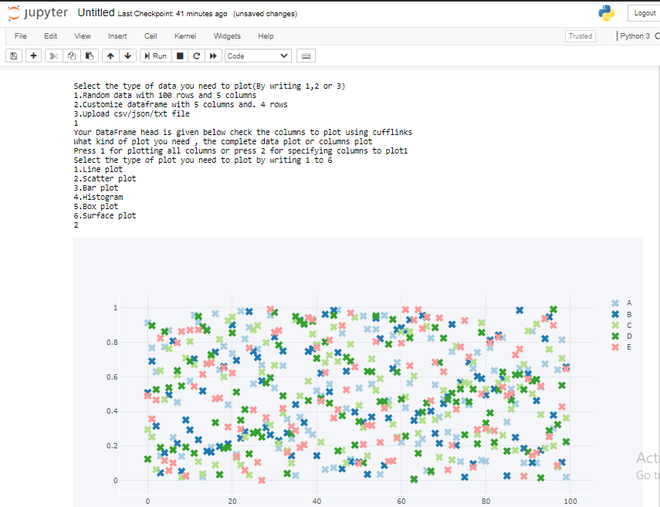
Gráfico de dispersión:

Gráfico de dispersión
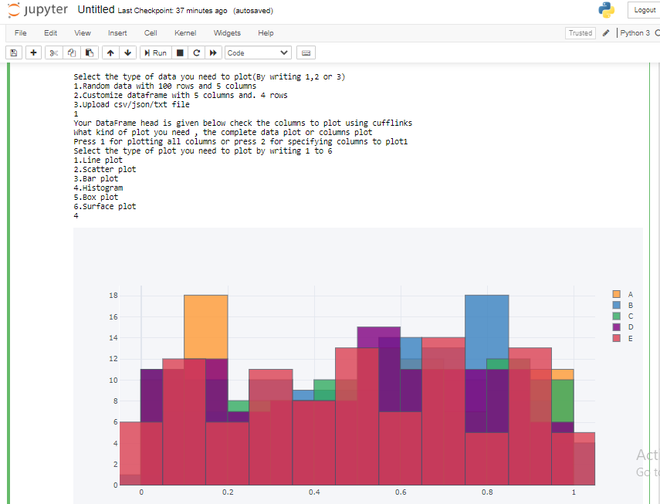
Gráfico de histograma:

Gráfico de histograma
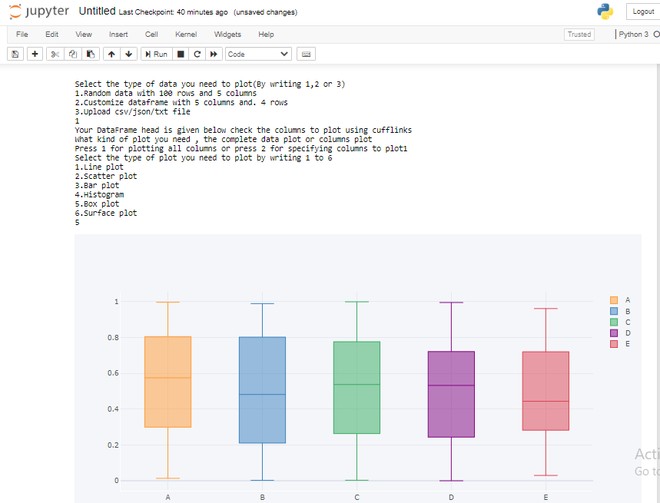
Diagrama de caja:

diagrama de caja
Publicación traducida automáticamente
Artículo escrito por deepkiyada7 y traducido por Barcelona Geeks. The original can be accessed here. Licence: CCBY-SA