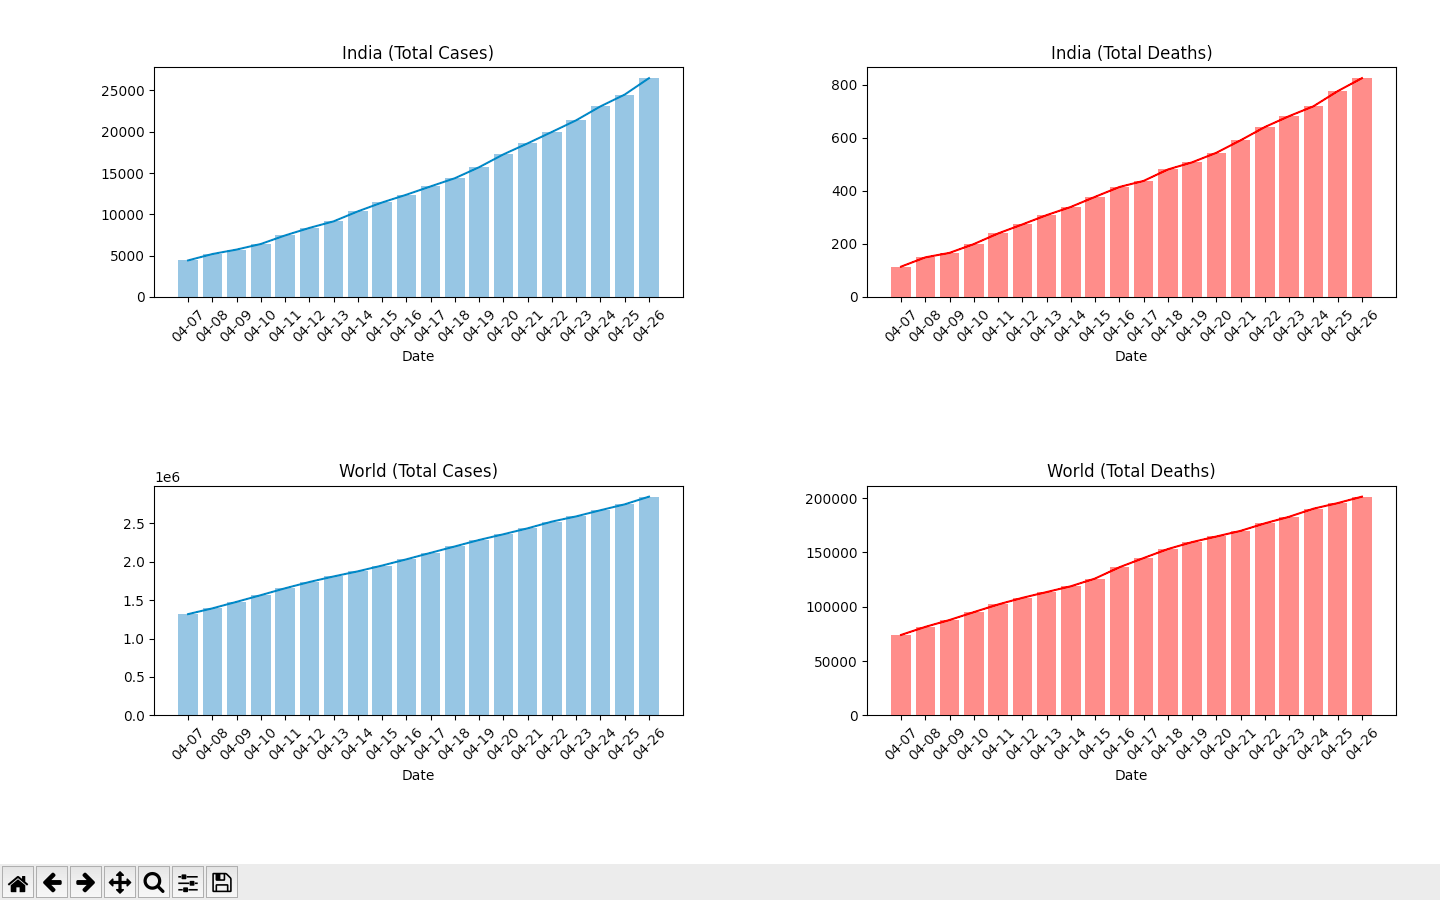
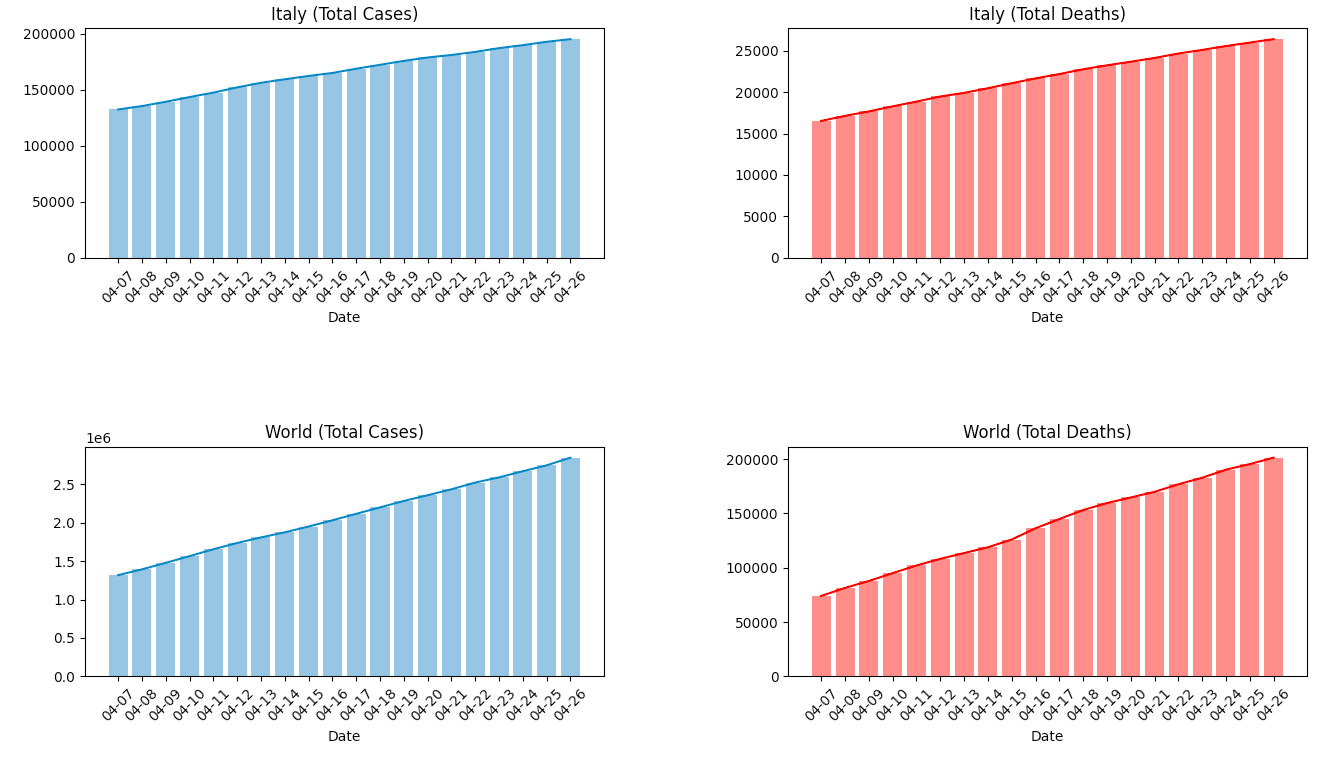
En este artículo, recopilaremos la información actualizada más reciente sobre los casos de coronavirus en todo el mundo y en un país en particular. Trazaremos gráficos para visualizar el crecimiento del número total de casos y el total de muertes durante los últimos 20 días. Los datos más recientes se obtienen de Our World in Data .
Módulos Python requeridos
- requests:
la biblioteca de requests se utiliza para realizar requests HTTP en Python.pip install requests
- matplotlib:
matplotlib es una biblioteca completa para crear varios tipos de gráficos y visualizaciones interactivas en Python.pip install matplotlib
Explicación:
Los datos extraídos del sitio web (mediante requests) se convierten al formato similar a csv. Luego, estos datos se filtran para obtener las estadísticas requeridas de los últimos 20 días y se trazan las visualizaciones (usando matplotlib).
A continuación se muestra la implementación.
from matplotlib import pyplot as plt
import requests


# function to plot data for country
# and world
def Plot(country):

    # getting request from the url
    req = requests.get('https://covid.ourworldindata.org / data / ecdc / full_data.csv')
    req.raise_for_status()

    # converting to text and splitting
    # the rows of the csv data
    cf = req.text.split('\n')

    # converting to 2 dimensional list
    for i in range(len(cf)):
        cf[i]= cf[i].split(', ')


    dates =[]
    total =[]
    total_w =[]
    deaths =[]
    deaths_w =[]
    l =[]
    f = 0


    for i in range(len(cf)-1):
        l = cf[i]
        c = l[1]

        # filtering data for a particular country
        if c == country:
            f = 1

            # getting the dates, total cases and
            # deaths for the particular country
            dates.append(l[0][5:])
            total.append(int(l[4]))
            deaths.append(int(l[5]))


        # filtering data for the world
        if c =='World':

            # getting total cases and deaths for
            # the world
            total_w.append(int(l[4]))
            deaths_w.append(int(l[5]))

    if f == 0:
        print("Invalid country name.")
        return


    # Plotting country data
    total_ax = plt.subplot(2, 2, 1)
    total_ax.set_title(country+' (Total Cases)')

    # plotting the curve for total cases
    total_ax.plot(dates[-20:], total[-20:])

    # plotting the bars for total cases
    total_ax.bar(dates[-20:], total[-20:], alpha = 0.5)

    total_ax.set_xlabel("Date")
    plt.xticks(rotation = 45)


    death_ax = plt.subplot(2, 2, 2)
    death_ax.set_title(country+' (Total Deaths)')

    # plotting the curve for deaths
    death_ax.plot(dates[-20:], deaths[-20:], color ='red')

    # plotting the bars for deaths
    death_ax.bar(dates[-20:], deaths[-20:], color ='red', alpha = 0.5)

    death_ax.set_xlabel("Date")
    plt.xticks(rotation = 45)


    # Plotting world data
    total_w_ax = plt.subplot(2, 2, 3)
    total_w_ax.set_title('World (Total Cases)')

    # plotting the curve for total cases
    total_w_ax.plot(dates[-20:], total_w[-20:])

    # plotting the bar for total cases
    total_w_ax.bar(dates[-20:], total_w[-20:], alpha = 0.5)

    total_w_ax.set_xlabel("Date")
    plt.xticks(rotation = 45)


    death_w_ax = plt.subplot(2, 2, 4)
    death_w_ax.set_title('World (Total Deaths)')

    # plotting the curve for deaths
    death_w_ax.plot(dates[-20:], deaths_w[-20:], color ='red')

    # plotting the curve for deaths
    death_w_ax.bar(dates[-20:], deaths_w[-20:], color ='red', alpha = 0.5)

    death_w_ax.set_xlabel("Date")
    plt.xticks(rotation = 45)


    plt.tight_layout()


print("Enter country name...")
country = input().title()
Plot(country)
plt.show()
Aporte :
Enter country name...
India
Producción :

Aporte :
Enter country name...
Italy
Producción :

Publicación traducida automáticamente
Artículo escrito por cosine1509 y traducido por Barcelona Geeks. The original can be accessed here. Licence: CCBY-SA