Matplotlib es una biblioteca de python popular que se utiliza para trazar. Proporciona una API orientada a objetos para representar gráficos de GUI.
Trazar una línea horizontal es bastante simple, usando axhline()
función axhline()
Sintaxis: matplotlib.pyplot.axhline(y, color, xmin, xmax, estilo de línea)
Parámetros:
- y: Posición en el eje Y para trazar la línea, acepta números enteros.
- xmin y xmax: escalar, opcional, predeterminado: 0/1. Traza la línea en el rango dado
- color: color para la línea, acepta una string. por ejemplo, ‘r’ o ‘b’.
- linestyle: Especifica el tipo de línea, acepta una string. por ejemplo, ‘-‘, ‘–’, ‘-.’, ‘:’, ‘Ninguno’, ‘ ‘, ”, ‘sólido’, ‘guión’, ‘guión’, ‘punteado’
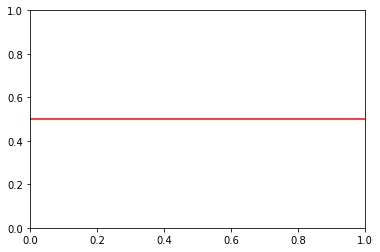
Trazar una sola línea horizontal
Python3
# importing library
import matplotlib.pyplot as plt

# specifying horizontal line type
plt.axhline(y = 0.5, color = 'r', linestyle = '-')

# rendering the plot
plt.show()
Producción:
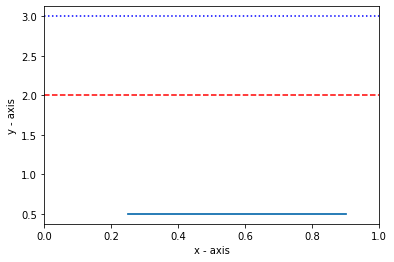
Trazado de varias líneas horizontales
Para trazar varias líneas horizontales, utilice el método axhline() varias veces.
Python
# importing the module
import matplotlib.pyplot as plt

# plotting line within the given range
plt.axhline(y = .5, xmin = 0.25, xmax = 0.9)

# line colour is blue
plt.axhline(y = 3, color = 'b', linestyle = ':')

# line colour is white
plt.axhline(y = 1, color = 'w', linestyle = '--')

# line colour is red
plt.axhline(y = 2, color = 'r', linestyle = 'dashed')

# adding axis labels
plt.xlabel('x - axis')
plt.ylabel('y - axis')

# displaying the plot
plt.show()
Producción:
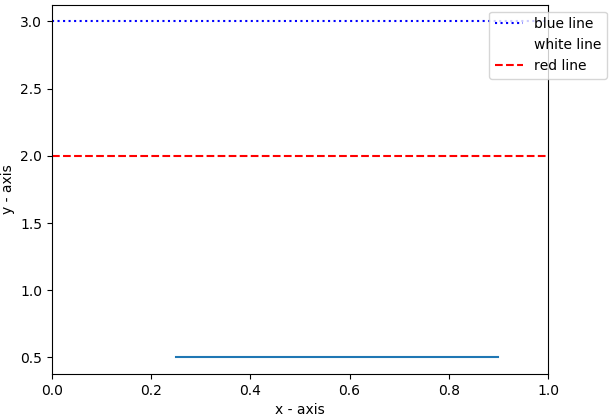
Agregando la leyenda
La leyenda se puede agregar usando la función legend() .
Python3
# importing the module
import matplotlib.pyplot as plt

# plotting line within the given range
plt.axhline(y = .5, xmin = 0.25, xmax = 0.9)

# line colour is blue
plt.axhline(y = 3, color = 'b', linestyle = ':', label = "blue line")

# line colour is white
plt.axhline(y = 1, color = 'w', linestyle = '--', label = "white line")

# line colour is red
plt.axhline(y = 2, color = 'r', linestyle = 'dashed', label = "red line")

# adding axis labels
plt.xlabel('x - axis')
plt.ylabel('y - axis')

# plotting the legend
plt.legend(bbox_to_anchor = (1.0, 1), loc = 'upper center')

# displaying the plot
plt.show()
Producción:
Publicación traducida automáticamente
Artículo escrito por technikue20 y traducido por Barcelona Geeks. The original can be accessed here. Licence: CCBY-SA