Jupyter Notebook es una aplicación web de código abierto que le permite crear y compartir documentos que contienen código en vivo, ecuaciones, visualizaciones y texto narrativo. Los usos incluyen limpieza y transformación de datos, simulación numérica, modelado estadístico, visualización de datos, aprendizaje automático y mucho más. Nota: Para obtener más información, consulte Cómo usar Jupyter Notebook: una guía definitiva. Matplotlib es uno de los paquetes de Python más populares que se utilizan para la visualización de datos. Es una biblioteca multiplataforma para hacer gráficos 2D a partir de datos en arrays. Para comenzar, solo necesita realizar las importaciones necesarias, preparar algunos datos y puede comenzar a trazar con la ayuda de plot()función. Cuando haya terminado, recuerde mostrar su diagrama usando la función show() . Matplotlib está escrito en Python y utiliza NumPy , la extensión matemática numérica de Python. Consta de varios gráficos como:
- Línea
- Bar
- Dispersión
- Histograma
- Y muchos más
Instalación
- Instale Matplotlib con pip Matplotlib también se puede instalar usando el administrador de paquetes de Python, pip. Para instalar Matplotlib con pip, abra una ventana de terminal y escriba:
pip install matplotlib
- Instale Matplotlib con Anaconda Prompt Matplotlib se puede instalar usando Anaconda Prompt. Si el indicador de Anaconda está disponible en su máquina, generalmente se puede ver en el menú Inicio de Windows. Para instalar Matplotlib, abra el indicador de Anaconda y escriba:
conda install matplotlib

Usando Matplotlib con Jupyter Notebook
Después de completar la instalación. Comencemos a usar Matplotlib con Jupyter Notebook. Trazaremos varios gráficos en Jupyter Notebook usando Matplotlib.
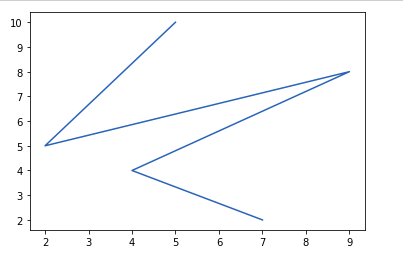
Gráfico de línea
Python3
# importing matplotlib module
from matplotlib import pyplot as plt

# x-axis values
x = [5, 2, 9, 4, 7]

# Y-axis values
y = [10, 5, 8, 4, 2]

# Function to plot
plt.plot(x, y)

# function to show the plot
plt.show()
Producción:
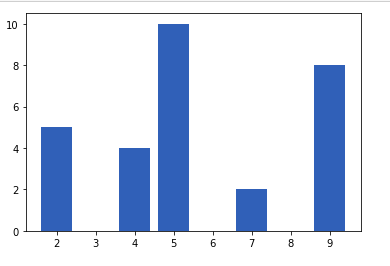
Parcela de barra
Python3
# importing matplotlib module
from matplotlib import pyplot as plt

# x-axis values
x = [5, 2, 9, 4, 7]

# Y-axis values
y = [10, 5, 8, 4, 2]

# Function to plot
plt.bar(x, y)

# function to show the plot
plt.show()
Producción:
Histograma
Python3
# importing matplotlib module
from matplotlib import pyplot as plt

# Y-axis values
y = [10, 5, 8, 4, 2]

# Function to plot histogram
plt.hist(y)

# Function to show the plot
plt.show()
Producción : 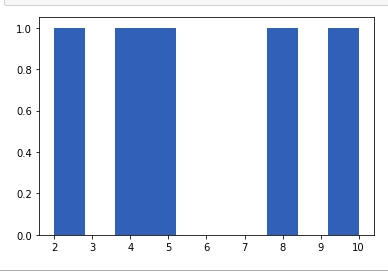
Gráfico de dispersión
Python3
# importing matplotlib module
from matplotlib import pyplot as plt

# x-axis values
x = [5, 2, 9, 4, 7]

# Y-axis values
y = [10, 5, 8, 4, 2]

# Function to plot scatter
plt.scatter(x, y)

# function to show the plot
plt.show()
Producción : 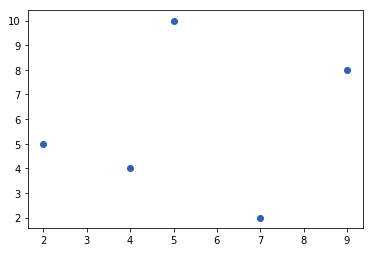
Agregar título y etiquetar los ejes en el gráfico
Podemos agregar un título al gráfico usando el siguiente comando
matplotlib.pyplot.title("My title")
Podemos etiquetar el eje x y el eje y usando las siguientes funciones
matplotlib.pyplot.xlabel("Time (Hr)")

matplotlib.pyplot.ylabel("Position (Km)")
Ejemplo :
Python3
# importing matplotlib module
from matplotlib import pyplot as plt

# x-axis values
x = [5, 2, 9, 4, 7]

# Y-axis values
y = [10, 5, 8, 4, 2]

# Function to plot
plt.scatter(x, y)

# Adding Title
plt.title("GeeksFoeGeeks")

# Labeling the axes
plt.xlabel("Time (hr)")
plt.ylabel("Position (Km)")

# function to show the plot
plt.show()
Salida: 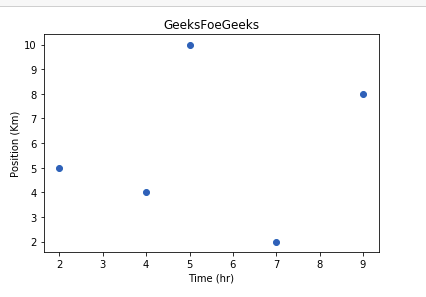 También podemos escribir un programa en la misma celda para imprimir varios gráficos juntos. Podemos imprimir estos gráficos verticalmente uno debajo del otro repitiendo la función show() en el programa o podemos usar una función llamada subplot() para imprimirlos también horizontalmente.
Python3
from matplotlib import pyplot as plt


x = [1, 2, 3, 4, 5]
y = [1, 4, 9, 16, 25]
plt.scatter(x, y)

# function to show the plot
plt.show()

plt.plot(x, y)

# function to show the plot
plt.show()
Producción 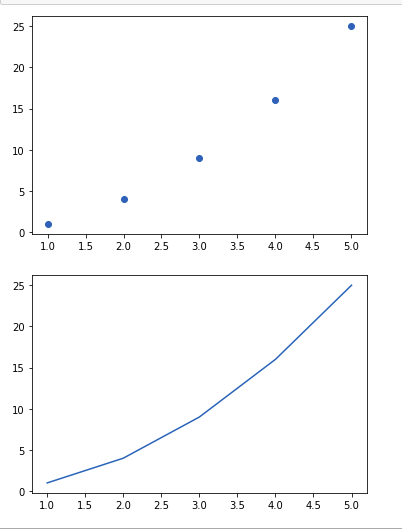
Publicación traducida automáticamente
Artículo escrito por shardul_singh_tomar y traducido por Barcelona Geeks. The original can be accessed here. Licence: CCBY-SA