KNN es uno de los algoritmos de clasificación más utilizados en el aprendizaje automático. Para saber más sobre el algoritmo KNN, lea aquí Algoritmo KNN
Hoy vamos a ver cómo podemos implementar este algoritmo en OpenCV y cómo podemos visualizar los resultados en un plano 2D mostrando diferentes características de las clases que tenemos en nuestros datos de entrenamiento.
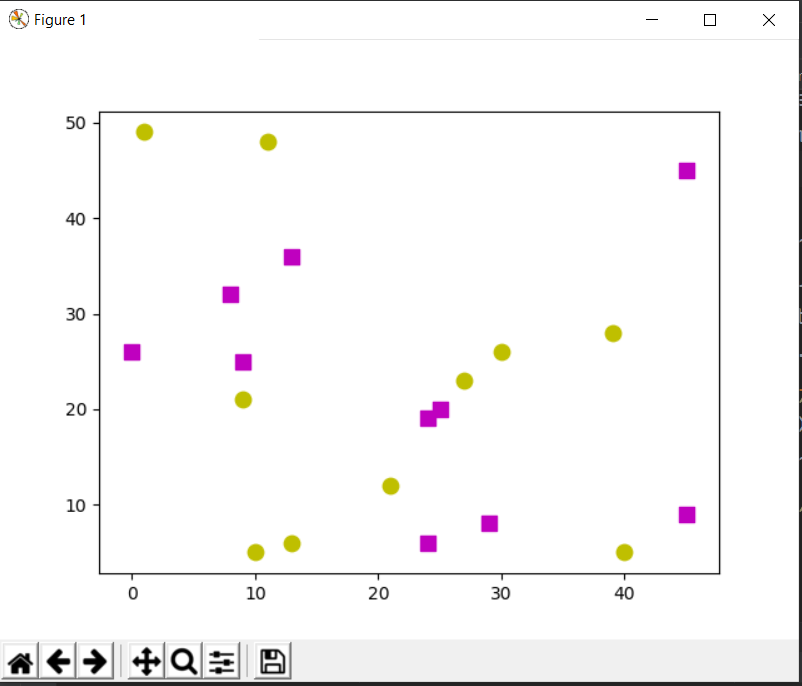
Consideremos dos clases para nuestro código. Generamos 20 puntos de datos aleatorios pertenecientes a las 2 clases usando un generador aleatorio. Los puntos de entrenamiento serán de clase ‘magenta’ o clase ‘amarilla’ . El magenta se dibuja como un cuadrado y la etiqueta para magenta es 1, de manera similar, el amarillo se dibuja como un círculo y se etiqueta como 0.
Código:
Python3
# Import necessary libraries
import cv2 as cv
import numpy as np
import matplotlib.pyplot as plt

# Create 20 data points randomly on the 2-D plane.
# Data_points are random points located on the 2D plane.
Data_points = np.random.randint(0, 50, (20, 2)).astype(np.float32)

# Label the data points with their class labels.
labels = np.random.randint(0, 2, (20, 1)).astype(np.float32)
# labels are the classes assigned to data points.

# Take the yellow class for 0 label and magenta class for 1 label
yellow = Data_points[labels.ravel()== 0]
magenta = Data_points[labels.ravel()== 1]

# Plot the classes on the 2-D plane
# o for circle
plt.scatter(yellow[:, 0], yellow[:, 1], 80, 'y', 'o')
# s for square
plt.scatter(magenta[:, 0], magenta[:, 1], 80, 'm', 's')
plt.show()
Producción:
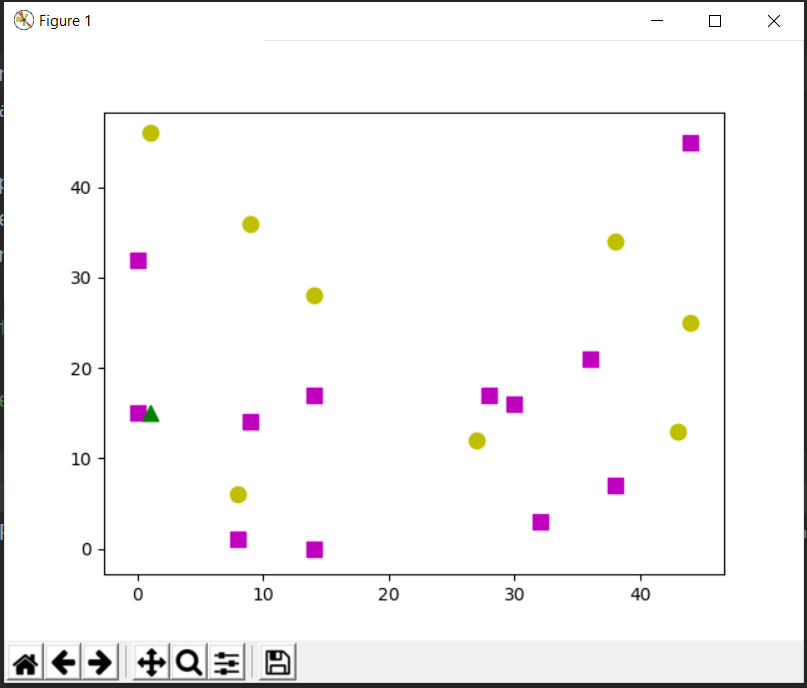
Ahora considere un nuevo punto de datos desconocido, nuestro clasificador KNN etiquetará ese punto de datos como 0 o 1 según sus características y la cantidad de vecinos que definamos.
Código:
Python3
# generate a random data point
# unknown is a random data point for which we will perform prediction.
unknown = np.random.randint(0, 50, (1, 2)).astype(np.float32)
# create the knn classifier
knn = cv.ml.KNearest_create()

# we use cv.ml.ROW_SAMPLE to occupy a row of samples from the samples.
knn.train(Data_points, cv.ml.ROW_SAMPLE, labels)
# get the labelled result, the numbers, the distance of each data point.
# find nearest finds the specified number of neighbours and predicts responses.
ret, res, neighbours, distance = knn.findNearest(unknown, 5)

# For each row of samples the method finds the k nearest neighbours.
# For regression problems, the predicted result is a mean of all the neighbours.
# For classification, the class is determined by the majority.

# plot the data point with other data points
plt.scatter(unknown[:, 0], unknown[:, 1], 80, 'g', '^')
# show the result.
plt.show()

# print the results obtained
print( "Label of the unknown data - ", res )
print( "Nearest neighbors -  ", neighbours )
print( "Distance of each neighbor - ", distance )
Producción:
Label of the unknown data -  [[1.]]
Nearest neighbors -   [[1. 1. 0. 1. 1.]]
Distance of each neighbor -  [[  1.  65. 130. 173. 245.]]
Publicación traducida automáticamente
Artículo escrito por KaranGupta5 y traducido por Barcelona Geeks. The original can be accessed here. Licence: CCBY-SA